If you follow top analyst firms or media outlets, you’re no stranger to the terms location intelligence, location analytics, and maps. Perhaps you’re already visualizing and analyzing the “where” of your data on a map. But are you actually getting the insights you’re after? Are you analyzing location data at the level of granularity needed to truly call your analysis complete?
Let’s look at five things you should consider to help you make the most of your analysis.
#1 – It’s not about what you see, it’s about what you can do with a map
Most Analytics & BI platforms are great for visualizing points on a map. But, if you’re an analyst, these points only lead to more questions. (And while we’re on the subject, why are you restricted to just points, what if your data consists of areas or lines?) To answer these deeper questions and get to real insights, you need the proper tools.
Don’t settle – do more with a map. Esri, the global leader and pioneer in using maps for rich analysis for 50 years, offers visualization and analysis capabilities within its self-service location analytics product, Insights for ArcGIS. Easily prepare data and go far beyond simple points on a map.
From a visualization standpoint, Esri offers 50 plus out-of-the-box vector maps. Vector maps are really just one of many types of file formats that Esri and Insights supports. They are commonly made up of basemaps: data layers that give you visual context of the area you’re analyzing, such as the topography, imagery, streets, and terrain. Not only do vector maps give you rapid scalability and rendering when you zoom and navigate a map, but Esri offers a variety of localized and stylized vector maps that help you communicate your story, your way.
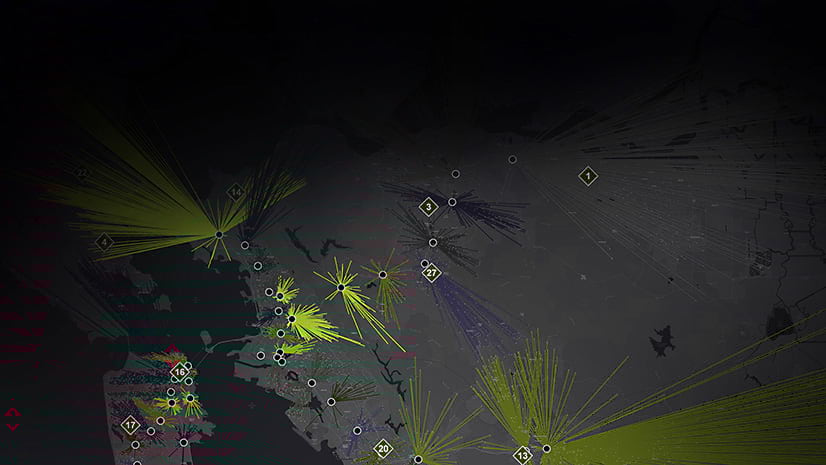
In addition to vector maps, Esri’s Insights for ArcGIS gives you analysis capabilities unlike any other analytical platform on the market today, especially from a spatial standpoint. For example, on-the-fly link analysis, also known as graph analytics. Perform this type of analysis on a map or a chart to uncover relationships between people, places, events, and other entities. Link maps connect the dots for you, but they also model relationships and connectivity, revealing the strength of those relationships. A thicker line and bigger node (point) will indicate a stronger relationship between the places you are connecting. Insights has many more spatial analytic operations just like this.
#2 – The world isn’t flat, and neither is your data
With solutions like Insights for ArcGIS, Esri makes it easy to work with any map projection (any 2D map of the Earth). Why do projections matter? It’s all about accuracy. If you use the wrong projection, your analysis can also be wrong. While others might consider projections trivial, Esri’s 50 years of experience with users’ real-life challenges has proved their importance.
Envision peeling an orange. Now, try to flatten it without ripping it. Difficult right? This is why not one map projection fits all analyses. A rule of thumb, see what map projection your data is in so you can properly analyze it. Let’s look at an example.
Say we’re calculating the shortest route for a contracted truck driver travelling from Portland, OR to Gresham, OR. Contracted drivers are paid by the distance covered, so our analysis results need to be accurate to ensure that the company doesn’t pay more than it should. As you can see above, we’re comparing the calculated distance when using three different projections: Web Mercator (what most Analytics and BI platforms use) and State Plane Oregon North and UTM Zone (projections most appropriate for northwest Oregon). If the analysis is done using Web Mercator, it results in the company paying for about 8,100 more meters. This is a huge discrepancy, which adds up, especially if the same route is traveled daily. Projections matter.
Because projections matter, Insights for ArcGIS supports over 6,400 coordinate reference systems. To help you take the guess work out of map projections, Insights intelligently handles most of this behind the scenes. That way, regardless of your data’s map projection, you can trust that Insights will give you accurate results.
#3 – Analysis starts and ends with data
And guess what, you already own a ton of location data. Almost all modern businesses today collect location information from their customers – whether it’s an address, GPS coordinates, city, state or zip code. According to Forrester Analyst, James McCormick, “Customers digitally [connect] to brands via PCs, then mobile devices, and now via a continuous tidal wave of emerging owned IoT devices (e.g., wearables, connected cars, etc.) and non-owned IoT devices (e.g., video, in-store tracking, etc.). Location is now critical to understanding the context of customer engagement in our rapidly digitizing physical world.”
Whether you’re a B2C or B2B company, customers expect personalized experiences that anticipate their needs before they even acknowledge they have them (think Amazon and Google). Data analytics is the foundation of these amazing customer experiences. We’d like to go a step further and assert that so is location analytics. Let’s break this down.
So you have location data. But is it ready for analysis? Probably not. Like most data, it must be prepped for analysis – perhaps you have different variations of a state’s spelling (CA, Cali, California, etc.) and you need to make it consistent. Or, maybe you need to join data of various formats and sources – say you want to analyze business revenue data along with weather, crime, development, and other factors. Unfortunately, most modern Analytics & BI platforms today can’t do this. Data can’t be visualized in a dashboard or report until it’s been heavily prepped and analyzed. Why not work with a solution that can do it all?
#4 – Add out-of-the-box authoritative data for much-needed context
Once your data is location-enabled, you can enrich that data with Census data or demographic, psychographic, environmental, and economic variables that comes with Insights. Easily combine over 8,000 US variables and hundreds of international variables to your data, then use that for further analysis and more insights. Updated regularly, Esri Demographics datasets are of high value with strong lineage, accuracy, and completeness, and they are all included with Insights.
#5 – Easily add the spatial component to your data
You may have heard the term geocoding. This is just a fancy way of describing the process of taking your data and adding a spatial component, allowing you to map it. Geocoding doesn’t mean that you need XY coordinates. You can geocode an address, street, city, state, or custom boundaries – pretty much anything with location information. Insights make this a simple 3-step process. We also offer reference layers: maps that contain boundaries that scale from country and state, all the way down to census tract or block group. These layers allow you to get super granular with your analysis.
Say, you’re trying to understand the sales of consumer packaged goods in the U.S. Consumer behavior differ greatly from state to state, more so from city to city, and even the lowest level of granularity, from block group to block group. The more you are able to scale in, the better, more accurate your analysis will be. Check out this fun Tapestry Segmentation app that allows you to explore this concept by examining your community’s behavioral characteristics.
We hope we inspired you to think more about what you’re getting from your maps. It really isn’t about what you see on a map, it’s about what you can do with the map that gives you real insight. We invite all analysts to join the thousands of organizations benefiting from the value of self-service location analytics with Insights for ArcGIS.
Ready to go beyond points on a map? Give true location analytics a try. Sign up for a free, 21-day trial to Insights for ArcGIS.


Commenting is not enabled for this article.