
National Maritime and Hydrography
Modernizing the maritime industry to support informed decisions
Create a stronger foundation for maritime information
The maritime sector for modern governments uses GIS to support national missions in three fundamental ways: increasing Safety of Life at Sea (SOLAS), improving decision-making processes, and driving economic benefits.
National hydrographic offices use ArcGIS to perform the following:
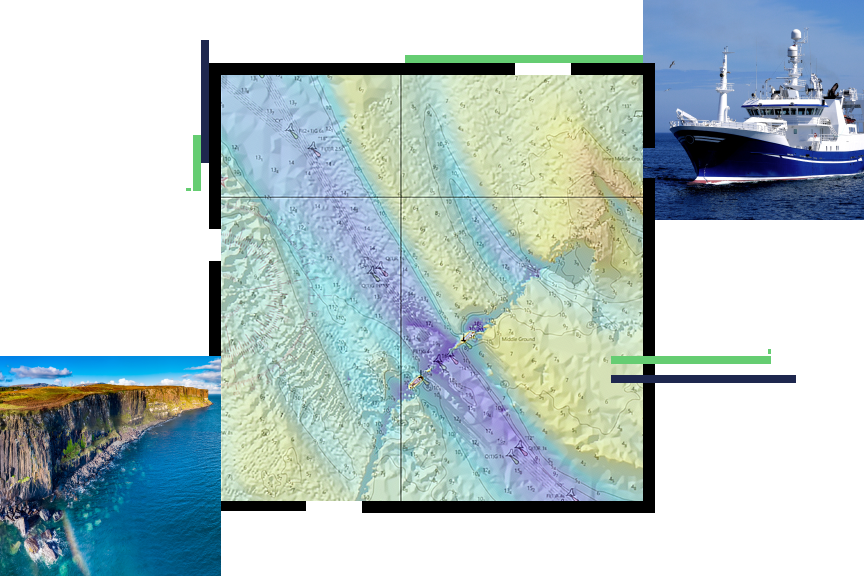
- Collect and manage observation data in the marine environment
- Produce authoritative maritime information, including navigation products
- Share information to ensure national prosperity and growth using a Marine Spatial Data Infrastructure (MSDI)

National maritime and hydrography strategies
Previous
Next
National maritime webinars and events
National maritime and hydrographic authorities need to stay up-to-date with the latest national modernization trends, technology, and information. Attend one of our informative webinars or speak to one of our national maritime industry experts at an event.

Our community
Find out how your peers are using Esri technology to achieve their goals.

Related mapping and charting industries
The complete picture of a nation's land, sea, and air mapping and charting is achieved in collaboration with national maritime, aviation, land record and cadastre, and official statistical authorities.
Previous
Next