October 3, 2018 |
Steve Snow | Mapping
Denmark once experienced its own Titanic moment.
On its maiden voyage on Jan. 30, 1959, Danish liner MS Hans Hedtoft struck an iceberg off the coast of Western Greenland. All 95 passengers and crew on board were lost, and the wreckage of the ship has never been found. Like the Titanic, the ship had been described as unsinkable.
This tragic event sparked a flurry of navigational charting activity by Danish Geodata Agency. Prior to the incident, the world had long needed good charts for all of Greenland.
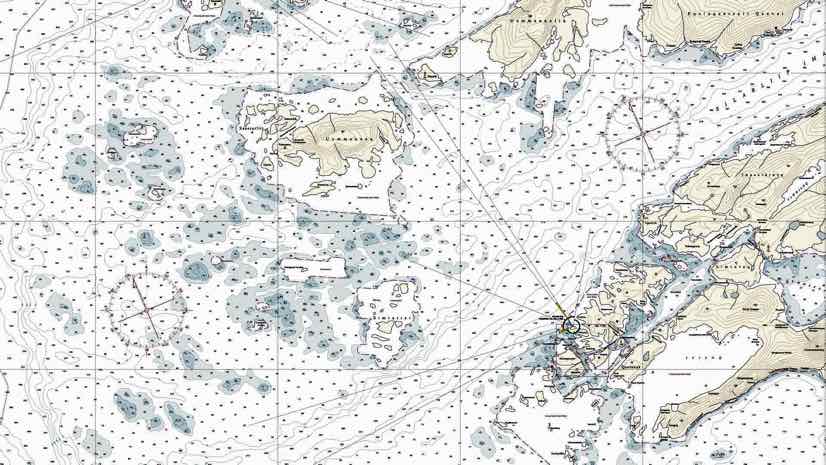
“In the 1960s, we used all available bathymetric and topographic sources in order to create the first set of Greenlandic charts,” said Rune Carbuhn Andersen, head of the Arctic Division of the Danish Hydrographic Office, a department within the Danish Geodata Agency. “The coastline for the charts was established in the 1940s and 1950s, and it still forms the foundation for the majority of the Greenlandic charts available today. Though the charts were accurate for the time, we now have to georectify old data with new data to produce an update.”
The renewed charting effort comes at a time when the world’s eyes are on Greenland. Many compare the country to a canary in the coal mine for climate change because of its rapidly melting ice sheets. Greenland’s navigational charts need to be updated to reflect the country’s changing coastline. And scientists, eager to monitor the melting ice, need to know how to safely navigate the waters.

Resource Challenges and Economic Opportunities
The possibility of ice-free Arctic waters is creating a growing demand for the region’s natural resources—minerals, uranium, petroleum, and fish once blocked by sea ice are now accessible and can become a part of global markets.
The largely untouched fish stocks drew interest first, given increasing pressure to feed the world’s growing population. A recent historical agreement on fishing prevents an unregulated and chaotic free-for-all. On the signing of this new accord, Denmark’s Minister for Foreign Affairs, Anders Samuelsen commented, “when the ice melts, we will face new challenges but also new opportunities. We need to manage both.”
With the melting, other new economic opportunities have come to this isolated island. Mining has recently emerged as a growth sector. A ruby pink sapphire mine operated by Norway’s LNS Group opened in 2017 and an anorthosite mine (a source for both calcium and aluminum) run by Canada’s Hudson Resources opened in February 2019. China has expressed interest in mining and other natural resources extraction and has framed the idea of a ‘Polar Silk Road’ to develop shipping lanes and build infrastructure throughout the Arctic.
This growing global economic interest fuels the need for updated charts that can enable safe passage and navigation.
“It’s very important for us to get all of the navigationally significant information that we have in the charts as soon as possible,” Andersen said. “We have one primary demand, and that’s safety at sea.”

Meeting the Safety Mission
Greenlandic waters are inherently dangerous, due to sea ice obstacles and unseen underwater rocks, frigid water temperatures, and swiftly changing weather.
“Fog and snow can come in very quickly,” Andersen said. “If you’re in a big ship on a big route, it doesn’t matter that much. If you’re in a smaller boat, then it gets dangerous.”
The short summer season and large and complex state of Greenland’s surrounding waters makes frequent surveying impossible. The goal for Andersen and his team is to define and survey navigational routes. They work to provide more than one route in a given area because fast-moving glacier ice often fills up an entire fjord, making the waters of a route unnavigable.
The Danish Navy produces most of the seabed mapping using multibeam echosounders. This type of sonar system measures the two-way travel time of sound waves transmitted from the vessel and received from a wide swath that is depth-dependent. Precision in measurement of time, vessel motion, and seawater characteristics allows for accurate representation of the undersea canyons and submerged rocks that aid, or impede, navigation through the treacherous waters.
Icebergs, free-floating chunks broken from glaciers or ice shelves, also present an ongoing problem, although onboard ship radar has helped dispel some of that danger.
“When we have an accident it’s usually due to a lack of experience,” Andersen said. “We had an accident on a very well-known rock close to Nuuk [the capital], which is an area where new and georectified charts have been released. The accident wasn’t the result of old or incorrect charts, it was probably more related to human errors on the bridge of the ship.”

Digital Transformation of Surveys, Workflows, and Charts
Starting in the 1990s, the Danish Geodata Agency spent much of its time and resources getting the charts of Danish waters ready for electronic navigational charts (ENC). This next-generation data product pushed adoption of digital workflows, allowing charting agencies to make chart updates with data collected by modern survey instruments such as GPS receivers and multibeam soundings.
“My department recently toured the bridge of one of the supply ships from Royal Arctic Lines to see how they navigate,” Andersen said. “They use the old paper charts along with radar, and they feel relatively safe. The problem is we can’t fit new data within these old charts and the world has long been moving to ENC.”
Capturing Greenland’s latest coastline data is an important part of the Danish Geodata Agency’s latest mission.
“Recognizing that we’re behind on Greenlandic chart production and not wanting to just sit on the latest data, we’ve tested an ENC Simple product,” Andersen added. “Where we have strong confidence on our coastline data, we have auto-generated depth data for ENC Simple using multibeam readings and soundings. We gave that to a few pilots in the summer and they liked it for its added security. If they saw an iceberg in the middle of their route, it gave them confidence that they could route around it without hitting any rocks compared to just using an old paper chart with very limited depth information.”
This test has led to further experiments. The Danish Geodata Agency must have complete confidence in this automation before it proceeds to production because if the automated chart misinterprets the depth of a channel or fails to record dangerous obstacles that were captured on previous charts it can be sued for negligence if mapping errors cause a shipwreck. While automation has proven helpful to both sea captains and the agency, it has yet to pass the test of becoming the authoritative charting source.
“It’s a big task to reproduce all the Greenlandic charts and ENCs given the complexity of the data and the large geographic area of sea surrounding Greenland,” Andersen said. “Despite the challenge, it’s a matter of years before we can release new charts with new GPS correct information. In the meantime, we hope to supplement them with alternative products like ENC Simple. But right now, we are focused on improving automation and production to get there.”
Learn more about how data authorities across the globe accelerate nautical chart production.