Skip to Content

Local Government

Racial equity tools for cities and counties

Working to achieve racial equity in city and county government

Cities, counties, and regions worldwide are addressing institutional racism to ensure opportunities for all their constituents—and geography is critical to the solution. ArcGIS can help in creating a future where race and place no longer shape experiences and outcomes.

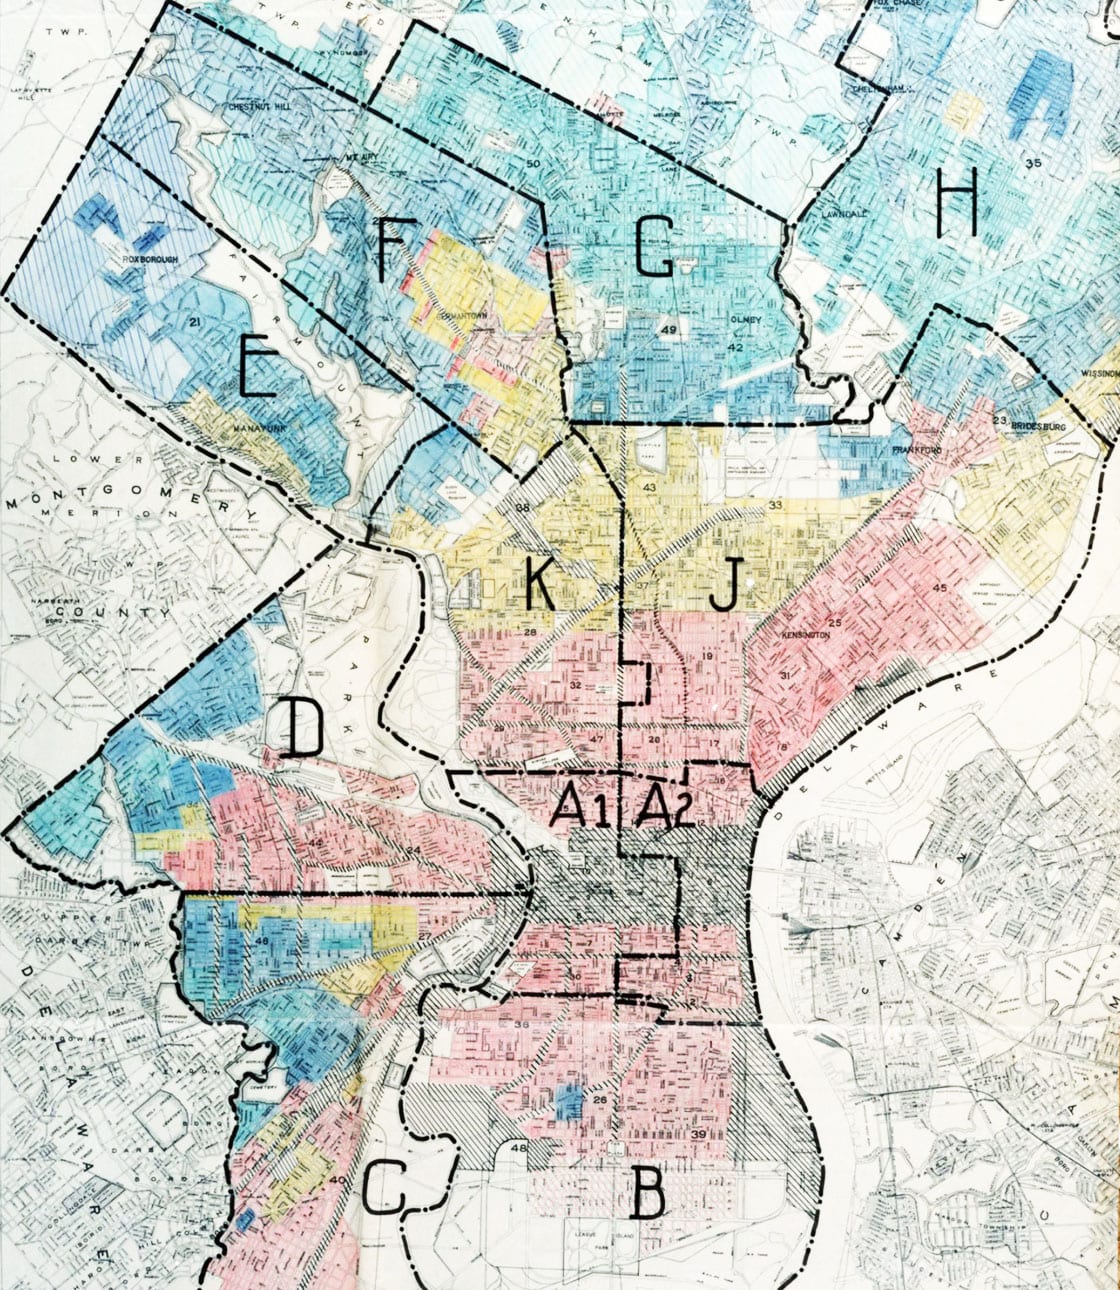
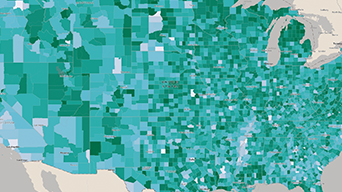
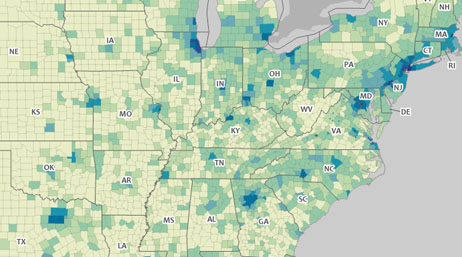
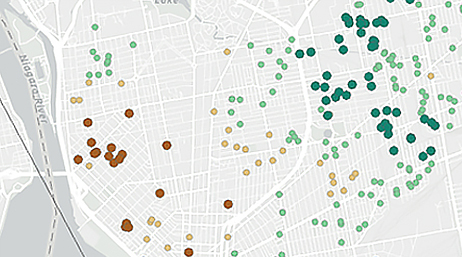
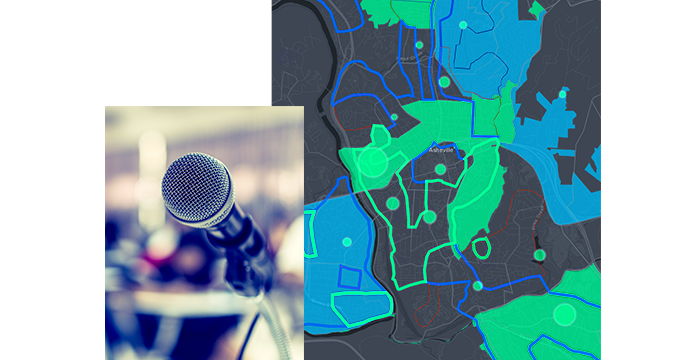
Map and analyze inequities

Apply a racial equity lens through maps and spatial analysis to reveal and understand inequities in experiences and outcomes in your community.

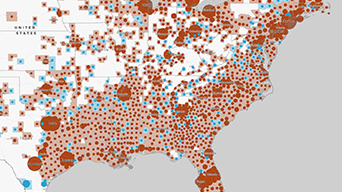
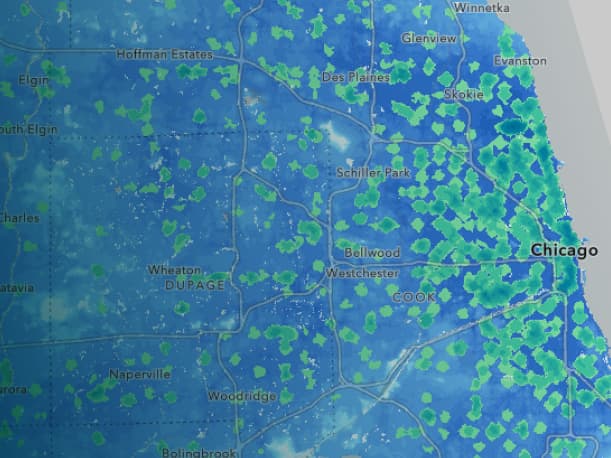
Operationalize racial justice best practices

Use maps, spatial analysis, and data to design, plan, and deliver equitable resource allocations that alleviate burdens on communities of color.

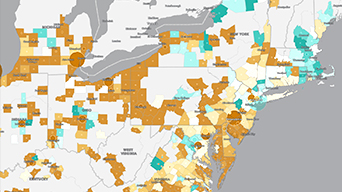
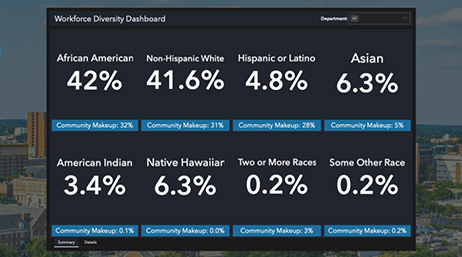
Manage performance for racial equity

Leverage decision-making tools to visualize racial inequities at a glance to adapt strategies and operations accordingly.

Racial equity and inclusion in local government services

Guide racial equity in programs and services

Apply a racial equity lens to city and county programs, services, and initiatives by using maps, spatial analysis, and dashboards to ensure equitable experiences and outcomes for communities of color. Measure results, set targets, and engage communities for maximum impact.

Young Black people sitting outdoors working on a community project

Ensure access to healthy and affordable food

Reveal gaps in access to affordable, healthy food for communities of color. Use maps and spatial analysis to visualize racial inequities where supermarkets and convenience stores lack produce and other nutritious food, and employ ground truth data to engage communities. Explore the potential impact of policy changes, and track progress in your city or county.

Black couple with a baby

Address racial inequities in education

Identify racial inequities in access to broadband, pre-K, and high-quality K–12 education and design more equitable experiences. Maps and spatially enabled tools for community engagement can provide insight into disparities and inform better decisions. Use map-centric dashboards to assess the impact of your efforts to ensure that all families in your community are thriving.

Two students sitting together, working on a school assignment

Create transparency in policing

Maps and spatially enabled tools can help bring together police agencies and the communities they serve to better understand, communicate, and engage on community-wide issues. Their use also allows agencies to increase trust within the community by providing greater transparency of activities, data collection, and how police-community initiatives are designed and performing.

A police officer giving a child a high-five

Datasets to help local governments further racial equity and social justice

Resources

Previous
Next

Esri Blog

Equity in urban design for the LA River

An urban designer applies qualitative and quantitative insights to ensure equity in the Upper Los Angeles River and Tributaries revitalization plan.

Read the article

Contact sales

Fill out this form, and we will contact you to help your government organization address racial inequity with GIS.