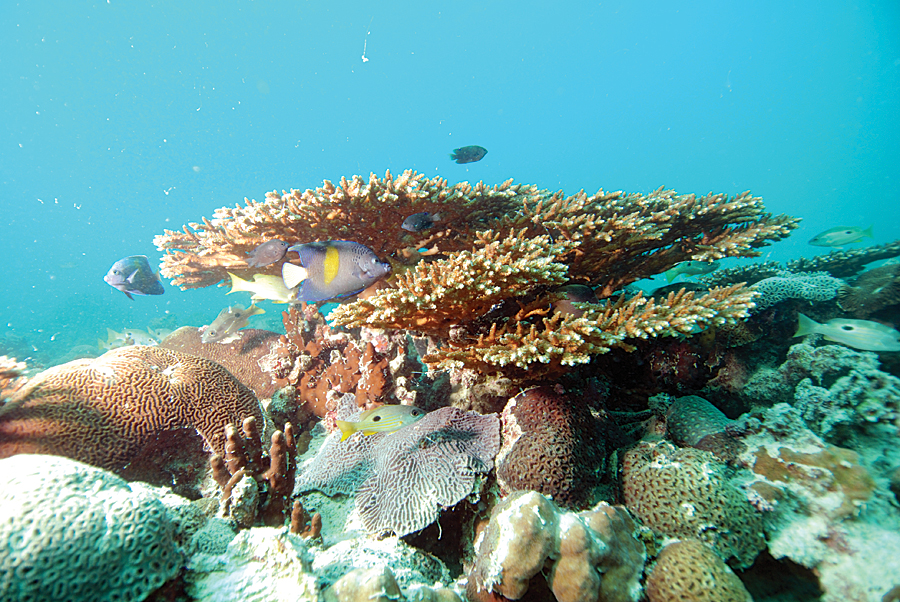
Although Abu Dhabi in Arabic means the father of deer, deer are not the only species Abu Dhabi is famous for. The capital city and largest emirate of the United Arab Emirates (UAE) hosts a stunning variety of habitats that support a vast array of species. Its rich marine habitats are home to endangered species, such as hawksbill and green turtles, four globally threatened shark species, and three threatened ray species. It is also home to the world’s second-largest population of dugongs, said to be the mammal behind the famous mermaid legend. Such a unique environment calls for dedicated attention. Therefore, Environment Agency—Abu Dhabi (EAD) was established in 1996, aiming to preserve and conserve this unique biodiversity and provide a clean and healthy environment for all.

EAD’s mission revolves around safeguarding environmental sustainability, preserving the environment, and ensuring that the realization of Abu Dhabi’s economic vision is aligned with the protection of its natural heritage. Having the right information at the right time is critical in achieving these objectives.
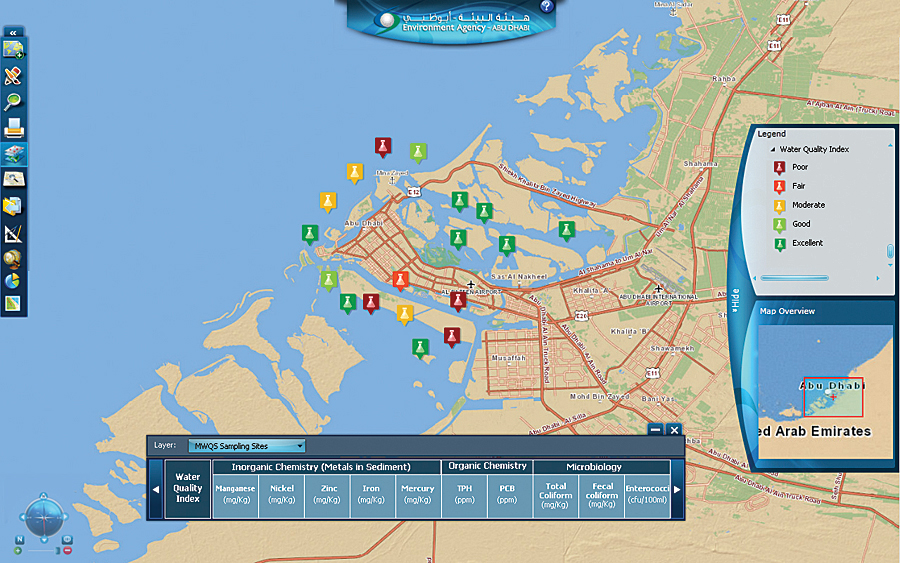
With the unprecedented economic development and associated socioeconomic changes in Abu Dhabi, certain negative impact on the marine and coastal environment was expected. This eminent risk brought forward a need for a comprehensive long-term marine water quality monitoring program. Under this program, marine water quality is monitored on sites in close proximity to public beaches, harbors, industrial areas, disposal sites and sewage outlets, desalination plants, and dredged channels. EAD had a need to manage the data and make it available to its stakeholders, including decision makers, specialists, academia, and the public. It is against this backdrop that EAD decided to develop a Marine Water Quality application using its existing Enviroportal platform to manage, analyze, and disseminate relevant data in the form of maps, charts, and reports. The application was also expected to replace the existing paper-based sample management with an electronic workflow.
After responding to a request for proposal, Esri Northeast Africa was awarded the project to develop the geospatial solution with Esri Geoportal Server, building on the Enviroportal, which is linked to EAD’s Environmental Database (EDB) that hosts more than 140 data layers across various environmental themes. The Marine Water Quality system, built on the ArcGIS platform, leverages the different data analysis tools to present data and information as multiple map layers depicting marine water quality of various areas in the Emirate of Abu Dhabi. The system has the ability to manage the entire life cycle of samples, including data analysis and, more importantly, dissemination.
Marine Water Quality Dissemination
The system tools enable informative mapping of the local marine environment. Using the classification capabilities of ArcGIS, the quality of marine water is represented through symbols that allow visual differentiation, enabling scientists to easily view the parameters that are exceeding their safe limits, along with their degree of exceedance. The public, on the other hand, can easily differentiate safe from threatening water quality in public beaches by a color-coded representation of marine water quality index (MWQI) on the map. The MWQI is automatically calculated by the system according to international standards and best practices.
Says Anil Kumar, director, Environment Information Management Division, EAD, “Providing such easily understood indication of water quality does not merely feed beach visitors’ interest in the safety of beaches they might visit, but it gradually builds the relation between the public and the environment.”

Policy makers can easily understand marine conditions through reports equipped with charts, statistics, summary tables, and maps. They can get immediate access to the updated data on exceeding parameters, complete sample details, parameter variation trends, and annual summary of marine water quality status.
“The direct integration between these reports and the water quality published at the end of a sample workflow guarantees accurate and immediate follow-up on water quality management and supports EAD’s long-term marine water quality monitoring program,” says Kumar.
Parameter variations over time are made available through intuitive, multilevel, customizable charts. Beach visitors interested in tracking marine quality over the past years, months, or even weeks, as well as scientists keen on observing parameter variation, can review and compare the quality of one or more parameters at one or more sites as an average annual value, decomposed into monthly values or even weekly values for detailed investigation. The Marine Water Quality system has helped EAD in managing the entire life cycle of the marine water quality sample right from the collection of samples to analysis and eventually dissemination in an efficient manner. It also assists EAD and its stakeholders in making better-informed decisions and increasing awareness on issues related to marine water quality.
Sample Life Cycle Automation
The system’s workflow automation enabled the direct update of sample test results to the EDB from authorized labs using standardized templates carefully designed to accommodate all required sample details. The system supports two types of users: data entry operators and supervisors. The data review and validation by the supervisor has been automated by cross-checking parameters against configurable thresholds. The supervisor’s decision is supported by an array of controls that enable a bidirectional workflow of acceptance or different types of rejection (Resample, Retest, Reject). The information management team controls the dissemination of sample test results according to a targeted audience (internal publishing to EAD users or publishing online to the public) and geography (one sampling site or all sampling sites in one area).
“The sample workflow,” says Kumar, “especially the review period, has been slashed significantly. Our staff are now able to focus on more valuable work.”
Marine Water Quality Data Analysis
Technical users are able to identify threshold-violating samples through instantaneous color scheme and timely automatic alerts on the map.
“The presentation of the violating sample on the map not only draws attention to the violation,” continues Kumar, “but also enables the user to relate the risk to the neighboring environment by manipulating the different environment map layers.”
Managers can identify workflow areas of deficiency by dynamic reporting of sampling volume in different workflow phases and at different roles, per a department, an area, or even a sampling site, through a statistical infograph.
“The integration of such a performance management tool extends the value of the system’s contribution to the overall marine water quality program as it provides a means of generating insights on continuous improvement by detecting potentially flawed workflow activities,” concludes Kumar.
For more information, contact Anil Kumar, TP, director, Environment Information Management Division, EAD (web: enviroportal.ead.ae/mapviewer/Default.aspx and www.ead.ae), or Nahla El Banhawy, Esri Northeast Africa.
