GIS Offers a Novel Way to Analyze Human Bones
Bone researcher David C. Rose straddles two worlds.
The Ohio State University (OSU) doctoral student in anthropology is also a captain in the University Police Division, a unique vantage point in which he sometimes deals with forensic investigations involving human remains.

That exposure—and his focus on skeletal biology—prompted Rose to launch a project to determine if patterns of change inside human bones might reveal how they were used during life.
Rose and coinvestigators Amanda M. Agnew, Timothy P. Gocha, Sam D. Stout, and Julie S. Field used ArcGIS (through Ohio State University’s Esri university site license) to identify and map features inside a human metatarsal (foot) bone—an entirely new way to study human skeletal and biologic variation. “I’ve got more than one career’s worth of work here,” quips Rose.
Rose began the project to explore how bones grow quickly, adapting to the load that is placed on them. “Patterns of tension and compression show up in our internal bone structure, and this software lets us look at those patterns in a new way,” he says.
The research is relevant for studying not only human internal bone structure but also that of other species, such as horses, says Rose. “We can use GIS to compare species and see how animals differ from us.”
Coresearcher Stout, professor of anthropology at Ohio State and Rose’s doctoral adviser, explains why the findings—first published online in the June 14, 2012, American Journal of Physical Anthropology—are important:
“Dave’s work allows us to visualize, analyze, and compare the distribution of microscopic features that reflect the development and maintenance of bones. We can then relate this to skeletal health and disease—for example, bone fragility in osteoporosis.”
One other study—published by researchers in Madrid in the June 2012 Journal of Structural Biology—used ArcGIS to map human long bone differentiation in shape, size, and tissue type during development from embryo to adult. But to the Ohio State research team’s knowledge, this is the first time anyone has used ArcGIS software to map and analyze the spatial distribution of bone microstructure.

The Genesis of a New GIS Application
How did Rose hit upon the novel notion of enlisting GIS into bone research?
Early on, he knew that GIS software could analyze nearly any kind of spatial data, from crime statistics to flood models. He even used it to map line-of-sight views while developing security plans for events on campus.
As it turned out, Rose had to take upper-level archaeology classes as part of his graduate school curriculum. His instructor, Field, an assistant professor of anthropology at Ohio State, used GIS extensively in her fieldwork to map the location of objects uncovered at excavation sites.
Field emphasized the need to identify important clusters of objects, such as household tools or agricultural tools, that would indicate patterns of human activity, recalls Stout. “Based on whatever scientific criteria you establish, GIS gives you a statistical measure of whether the objects you’re looking at actually constitute a cluster.”
According to Stout, Field saw the potential of Rose’s and his use of GIS as a research tool in measuring the distribution, size, shape, and strain history of bone microstructure.
“You’re trying to describe how strong a bone is for bending, tortion, and use,” Stout says. “How much of a load can it experience, and how much at risk is a person for a fracture? For example, this is useful data for designing air bags in cars to minimize the chance of incurring skeletal fractures.”
Small Bone Yields Big Results
For this study, which became his master’s thesis, Rose examined the cross-section of a metatarsal—a long bone in the foot—from a deceased woman who generously gave her body to the Division of Anatomy’s Body Donation Program. Using this bone cross-section, the team demonstrated how the software could be used to show the loads experienced in the foot during gait, or walking.

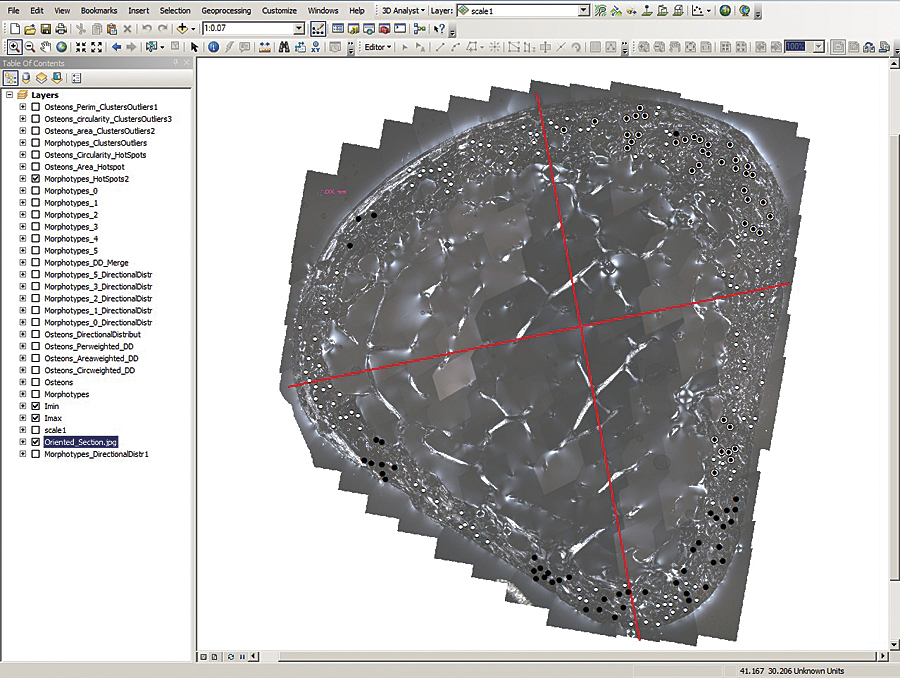
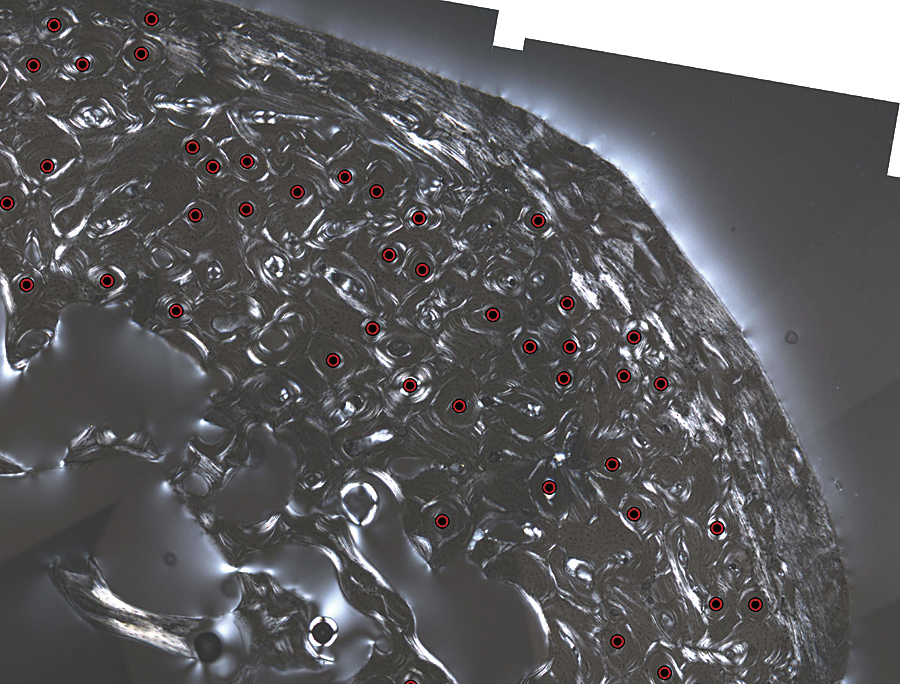
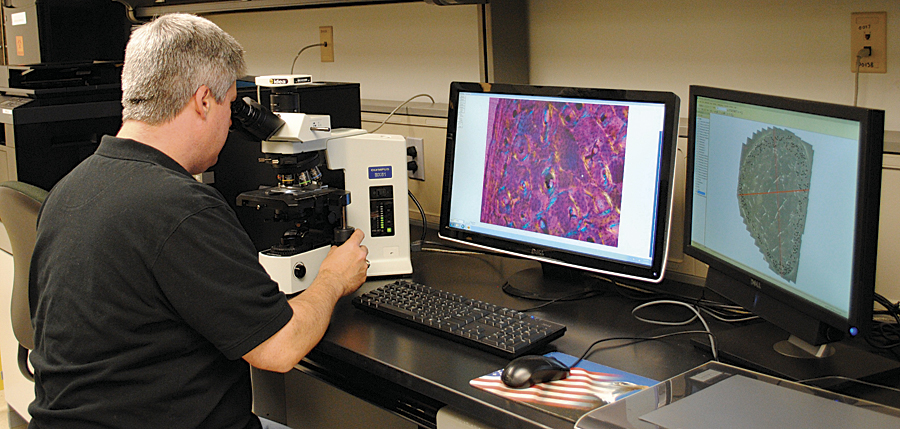
Rose recorded an extremely high-resolution image of the bone cross-section under a microscope. He used ArcGIS to map the location of key structures called osteons—the fundamental functional unit of compact bone.
Osteons are roughly cylindrical structures that are typically several millimeters long and around 0.2 millimeters in diameter. They are present in many bones of most mammals and some bird species. Also called the Haversian system, the structures are created throughout life to fix small cracks or maintain mineral levels in the blood. The size and shape of osteons, along with the direction of the collagen fibers from which they are made inside bone, are influenced by the loads placed on bones during life.
In this case, says Rose, the donor’s metatarsal bone showed the predicted pattern of normal bone remodeling. It had concentrations of particular types of osteons along the top and bottom of the bone that could have been formed by forces exerted as she walked.
“This was just where you would expect to see telltale signs of foot flexure and compression,” he says.
Rose acknowledges that his current technique is invasive and cannot be used on a living person. “But in the future, ‘nano-CT’ may examine a person’s bones to determine the risk of fragility and fracture,” he says.
Promising Technique Needs Refinement
Both Rose and Stout caution that this study provides only a proof of concept and that many more types of bones would need to be studied before GIS software could provide meaningful insight into bone biology.
Nevertheless, foot bones today are especially useful in forensics due to the sometimes gruesome reality of unidentified remains: often only foot bones are intact, having been protected by shoes. “Other bones may be chewed up by animals, but a well-preserved foot bone can be a very useful forensic application,” says Stout.
Rose added that to reliably use this tool for forensic applications calls for a better understanding of spatial distribution. “But that’s still some years away,” he says. “This is a new area of research, and right now only one group is working on this, and that is ours.”
At OSU, under Stout’s supervision, Rose is combining very basic concepts in GIS and skeletal biology. However, he foresees a tremendous opportunity for advances at the intersection of both disciplines.
“The real advantage to this method is that it offers a new scale for the study of human physical variation, offering to shed light on how we adapt to our surroundings.”
For more information, contact David Rose, captain, Police Division, Ohio State University (tel.: 614-292-6367), or visit research.osu.edu.
