
This is a common scenario for local governments: Someone buys a home in a neighborhood near (insert one of the following: a landfill, an airport, or a sewer plant), and before long, the homeowner considers the already existing facility to be a blight on his or her new investment.
While residents are ultimately responsible for knowing what exists around them, could cities also provide greater access to such information? In Chandler, Arizona, the answer is yes. But that was not always easy to accomplish.

Thirteen years ago, the proposed expansion of a solid waste transfer station prompted months of spirited community debate (and election fodder, as the issue morphed into a political football). Although the city had held public meetings and the plans had been on the books for more than a decade, nearby residents were alarmed and somewhat surprised by the facility.
As the dialog continued, staff from the city’s communications and public affairs department met with colleagues in the information technology (IT) division to develop an online map where the public could find information about city projects and facilities—both existing and proposed. It was an effort to eliminate buyer’s remorse for those looking to live in the Chandler community.
Called InfoMap, the first version was very basic. It consisted of a PDF-based map of Chandler with numbers denoting the locations of various facilities. When a user clicked a specific number, a separate PDF document would open that contained a description of the facility or project, along with an aerial photograph of the site. While workable, this PDF-based map did not allow users to select viewable areas, and adding to the map required special efforts from the IT team rather than having revisions be part of regular GIS data collection and maintenance activities.
Fast-forward to today, at which point Esri products have transformed InfoMap into an easy-to-use interactive tool that helps residents view information in ways that foster quick understanding. The newest iteration of InfoMap was built with Web AppBuilder for ArcGIS (Developer Edition) and provides a locally hosted solution that the city can both manage in-house and scale when needed.

The City of Chandler’s IT department was able to enhance its app development capabilities by motivating division stakeholders from utilities, traffic engineering, development services, and other groups to participate in nearly every discussion about the app’s required features. They had to make decisions about what information would be most useful to share with the public without overwhelming users with too many features or too much data.
What the city ended up with is a thorough, yet very clean, mapping app. It has a legend that lists the various facility types that are displayed on the map. Each facility type has a specific icon—an airplane for airports, a water droplet for water reclamation facilities, a plug and an outlet for electric vehicle charging stations, and so on. When a user selects an icon on the map, that activates a pop-up window with the facility’s description, address, phone number, and website.
A diverse group of GIS technicians from many of the city’s divisions maintains the data using ArcGIS Desktop and a custom web app built using ArcGIS API for JavaScript. Employing spatial views, they have combined several of the feature classes and related tables to allow for more user-friendly and well-formatted pop-up windows. This also enables them to update any pop-ups that link to PDFs or images dynamically when new data is added. Additionally, it was important that neither the app nor the data had any hard-coded URLs so IT staff could easily update a URL if the resource gets moved.
With a basemap selector, users can change the basemap from a topographic map to aerial imagery. And a search tool helps them locate addresses and facilities. Additionally, the Near Me widget, which employs the Esri World Geocoder for ArcGIS, allows users to type in an address and see which facilities are located around it.
The Neighborhoods widget is especially useful, as it shows the locations of city-registered neighborhoods, of which there are more than 300. Selecting a specific neighborhood opens a pop-up window that displays the number of homes it contains, the date it was established as an official neighborhood, any contact information (for a property management company, for example), and links to neighborhood maps that users can print out. If users can’t find their neighborhoods on InfoMap, they can contact the city’s Neighborhood Programs Office to get them registered.
To support this widget, the app’s developers combined data from many tables into a spatial view. For example, merging the neighborhood contact information table with the neighborhood polygon allows users to view contact information without having to click a related table link.
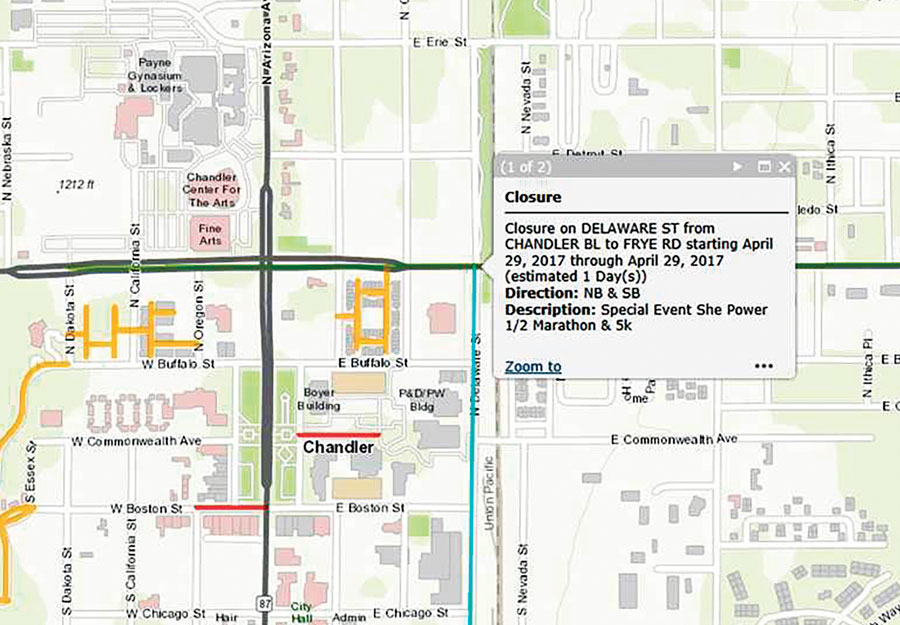
Traffic information is new to InfoMap. Any road restrictions now appear on the map as red, green, or blue lines, depending on their severity. To keep the data current, developers created a Python add-in that helps those who maintain the data in ArcGIS Desktop access the city’s traffic restriction data (which is housed in a custom database) and refresh the traffic restrictions feature class. Now, when users select a specific traffic restriction, an easy-to-read popup window opens that describes the restriction and estimates how long it will be in effect.
Also new to InfoMap is the layer that indicates which streets are privately owned and, therefore, not maintained by the city. This data layer appears as users zoom in to the map, and it disappears when they zoom out.
Although not part of the app, InfoMap also links to the city’s Planning and Zoning Signs Tool. From InfoMap’s initial splash page, users can click View Current Zoning Cases, which leads them to the planning division’s home page. That’s where they can access the tool, which shows the locations of current requests to change land use on specific pieces of property. The proposed land-use changes are highlighted in orange, and approved cases are purple (though those only remain visible for a short time). Users can select a case to see, via a pop-up window, the project’s name and case number; the city planner assigned to the case; his or her phone number; and, if scheduled, the dates of any public hearings. Users can also follow a link to the staff memo for each case, which details the city’s findings and recommendations for it.
To quote EnvironmentalScience.org, an organization that advocates science education and careers, “whether we understand and appreciate it or not, geography is vitally important in our everyday lives and understanding the geography around us and its importance is essential.”
Making information about Chandler’s “geography” easily available through InfoMap is a great way for the community to learn more about the city and advances Chandler’s commitment to greater transparency. Hopefully, it also helps residents avoid buyer’s remorse on one of the biggest purchases they may make in their lives.
About the Authors
Jim Phipps is the public information officer for the City of Chandler, and Jerry Corum is an IT programmer and analyst at the city. For more information, contact Phipps at jim.phipps@chandleraz.gov or 480-782-2224.
