ArcGIS helps San Diego residents adopt active transportation
Ross Martin imagines a new and improved San Diego County. He envisions communities in which residents commute to work on foot or by bicycle and where a network of safe routes offers easy access to schools, parks, shopping, and mass transit so that no San Diegan goes without daily exercise.
It’s no fantasy.
Martin, San Diego County’s GIS manager, is one of many participants in a decade-long effort—enabled by the ArcGIS platform—to bring such a utopian quality of life closer to reality through intensive study of the county’s pedestrian infrastructure.
“The county is halfway through a 10-year plan—called Live Well San Diego (LWSD)—to create healthy, safe, thriving communities,” Martin explained. LWSD is a multiagency initiative funded by an Active Transportation Program grant from the California Department of Transportation (Caltrans), the California state authority responsible for managing highways, bridges, and railways. LWSD participants include the county’s Health and Human Services Agency (HHSA) and Department of Planning and Development Services as well as its GIS team. Other partners include city governments within San Diego County, community-based organizations, nonprofits, and entities within the private sector.
“LWSD examines the root causes of illness and ties them back to safety, jobs, housing, and transportation,” Martin said. “The plan is built on a realization that we can’t simply provide health programs and education on how to make better choices. It has to be more systemic, more holistic. We’re now in a phase focused on community health based on the built environment.”
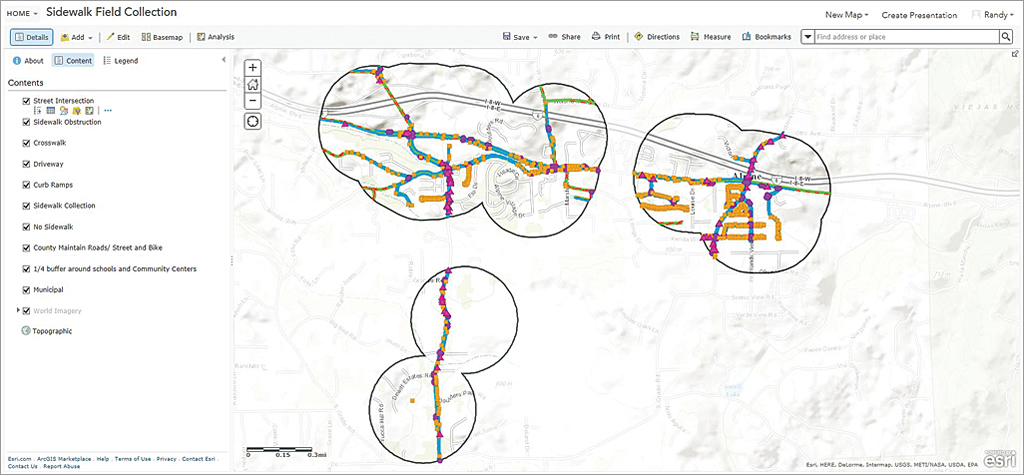
The effort includes an ambitious countywide walkability study—dubbed the Pedestrian Gap Analysis (PGA)—designed to collect actionable data on the availability and conditions of pedestrian routes in San Diego County. The study will help the county gain an understanding of the factors influencing residents’ transportation choices (Should I drive, or can I walk or bike?). It will assess where improvements in pedestrian infrastructure, such as sidewalks and bike paths, can provide maximum benefits in terms of both easier mobility and healthier lifestyles. For county residents, getting from point A to point B should involve more physical activity than steering a vehicle.
Employing Collector for ArcGIS in its data-gathering effort, San Diego County has been able to create more than just a comprehensive picture of its pedestrian network. The data emerging from PGA has provided the county with insights that could prove vital in reshaping the region and lead to smarter land use, less vehicle traffic, and healthier residents.
With an environment that ranges from beaches to deserts, an abundance of parkland, a comfortable climate, and a wide variety of outdoor recreational opportunities, San Diego already boasts one of the healthiest populations in the country. In its 2015 American Fitness Index, the American College of Sports Medicine listed San Diego as the third healthiest US city in which to live, citing an abundance of farmers’ markets and the popularity of biking and walking to work as factors that influenced the region’s ranking. San Diego’s AFI ranking has steadily improved over the last few years, most recently from 14th in 2013 to eighth in 2014.
Despite these positive indications, 54 percent of deaths in San Diego County can be attributed to diabetes, heart disease, strokes, cancer, and respiratory disease—ailments for which a lack of physical activity is known to be a contributing factor, according to Dale Fleming, strategy director for San Diego County’s HHSA. Fleming said that development strategies focused on the efficient movement of vehicle traffic, rather than on universally accessible multimodal transport, are partly to blame.
“This type of development is creating communities where streets are unsafe for pedestrians and bicyclists,” he explained, “and physical activity is no longer naturally a part of the everyday routine. Activities such as walking to school or using a bicycle to run errands have become unconventional. Since the 1970s, there has been a dramatic reduction in the number of children biking or walking to school and, conversely, a large spike in childhood obesity in that same 30-plus-year time span.”
As part of its mission to foster a safer, healthier environment in San Diego County, LWSD aims to reverse such trends by encouraging residents to engage in active transportation, such as biking or walking, on a daily basis.
Unfortunately, for many San Diegans, these choices are out of reach. Connectivity gaps in the pedestrian infrastructure—damaged sidewalks or pathways that simply don’t connect to other pathways—create barriers that prompt residents to drive rather than walk or bike.
For residents who don’t own cars, connectivity gaps are more than an inconvenience. “Pedestrian infrastructure becomes an important factor in providing equitable access to services for people who don’t have, or can’t access, means of transportation other than walking,” said Mark Wardlaw, director of San Diego County’s Department of Planning and Development Services. “If people need to walk to access transit services, pedestrian infrastructure becomes essential in making sure people can safely complete their trips.”
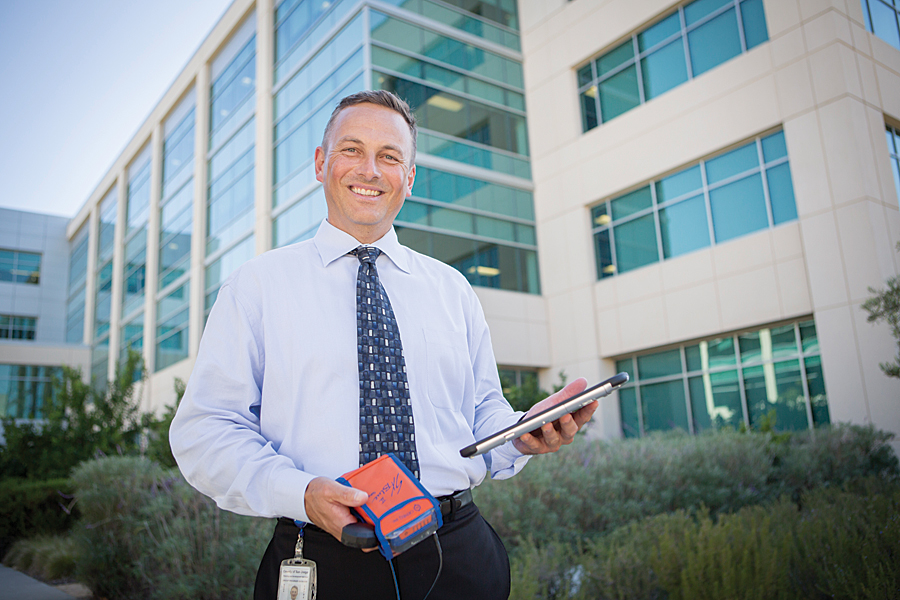
Enabling the lifestyle shifts embodied by the LWSD mission required a detailed assessment of San Diego County’s pedestrian infrastructure, which led to the PGA. This study has enabled the creation of a baseline that can inform decisions regarding community planning and targeted improvements to existing sidewalks and pathways. Field teams equipped with Samsung tablets used Collector for ArcGIS to gather data on the county’s pedestrian routes. They recorded hazards, impediments, and connectivity gaps.
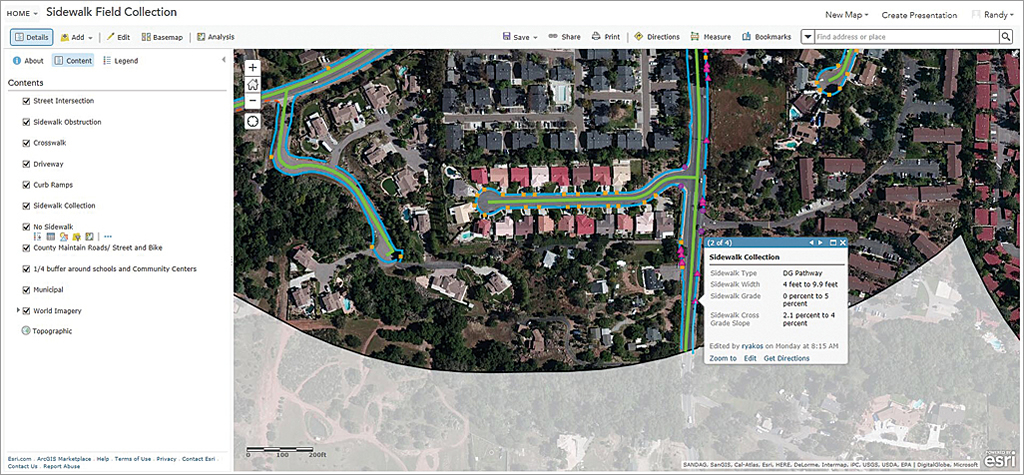
“They looked at simple things—like whether or not there were ADA [Americans with Disabilities Act]-compliant curb grades—to more complex hazards,” Martin said. “For instance, there’s a lot buried in sidewalks related to utilities. Are those [elements] too close to main travelways? Are bike pathways actually wide enough for bicyclists? Does a sidewalk transition to decomposed gravel, then to nothing but a shoulder, with heavy traffic traveling nearby?” Any of these conditions can dissuade residents from walking or biking along those routes.
Field data also included the locations of accessible public services and mass transit as well as recreational opportunities and grocery sources. Rates of crime and traffic accidents along pedestrian routes were added.
Tablets were paired with Arrow 100 units, high-precision global navigation satellite system (GNSS) receivers from Esri partner EOS Positioning Systems, to record pathways with geospatial accuracy to within one meter. Data could be accessed via ArcGIS Online, which provides opportunities for quality control and feedback to field personnel.
PGA data will inform county-level decisions regarding targeted capital improvement projects to repair damaged pedestrian infrastructure and close connectivity gaps between sidewalks and pathways. Benefits may be especially apparent in rural areas, where such gaps are more common.
“It’s eye-opening to see the gaps that exist,” Martin said. “The assumption may be that, since there’s a road, there must be an easily traveled pedestrian route next to that road. That’s not always the case.”
Even a short connectivity gap, such as a bridge shared by a street and a pedestrian/bike route, can pose a significant barrier.
“Imagine a family on bicycles having to cross that bridge,” Martin said. “Their travelway narrows, and they’re closer to cars. That’s a big concern for parents.”
Beyond creating a picture of the ways the county’s existing pedestrian infrastructure can be improved, PGA offers a unique planning tool that could enable future development decisions backed by a comprehensive sense of geographic order.
“In making planning decisions, we need to look at the community as a whole and the needs and resources of a community so it can be sustainable,” Martin said. “For instance, groceries have to be available. If you have to drive 45 minutes, that means changes are needed in land use. And one of the goals is to get people out of their cars—walking, biking, or taking their bikes to the bus stop. Pedestrians will walk about a quarter mile or bike as much as a half mile before distance becomes a deterrent. In the planning stage, we need to consider where those people want to go. Where are the parks, the libraries, the markets?”
The picture provided by PGA data could enable planning strategies that bring residential, commercial, and recreational spaces into closer proximity, as land use, transit, and public services are considered in conjunction, rather than as independent efforts, each on its own timeline. Martin foresees developers working to maximize pedestrian features in new developments as well as in existing communities. Meanwhile, Fleming reports that planning discussions at county and city levels have already begun to emphasize “complete streets projects”—those that keep all types of road users in mind.
“As communities become more pedestrian-oriented, families can walk to dinner rather than drive,” Martin said. “Children can safely bike to school rather than be driven. People can live and work in the same area, and neighborhoods can thrive. Long term, this enhances the sustainability of these communities.”
About the author