Fall 2003
Fall 2003 |
|||||||
|
|
|||||||
National Oceanic and Atmospheric Administration Uses GIS to Monitor the Coastal Zone |
|||||
|
In the United States, monitoring the coastal zone, as it is commonly known, is the responsibility of the National Oceanic and Atmospheric Administration (NOAA), which was established in 1970. Early predecessors of NOAA include the United States Coast Survey, which was established in 1807 by Thomas Jefferson. In 1878, that agency's name was changed to the Coast and Geodetic Survey to reflect the growing role of geodesy in its work.
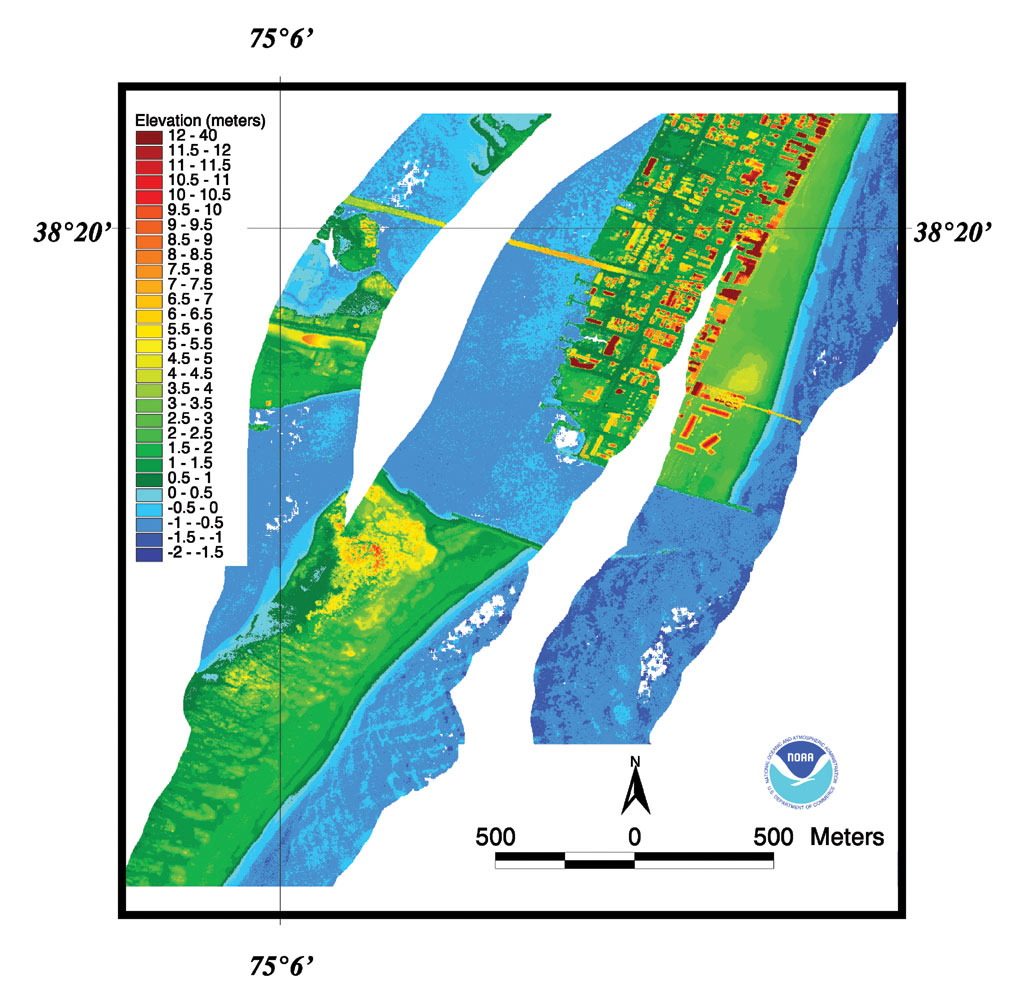
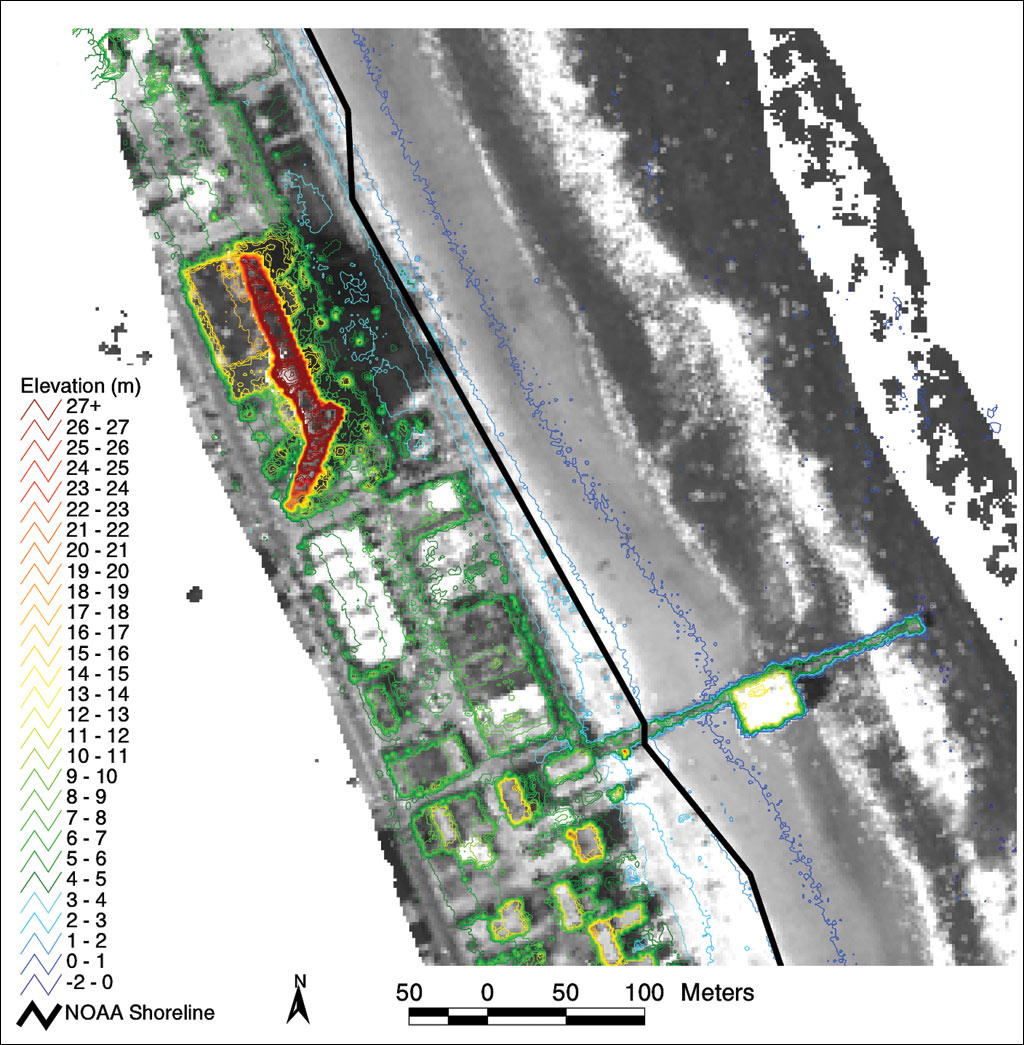
Fundamental to managing a coastline is first determining its location. This may seem obvious, but Cindy Fowler, information technology specialist at NOAA's Coastal Services Center, says, "Determining the location of a shoreline is one of our agency's biggest challenges as well as being one of our most important responsibilities. The shoreline is a critical boundary for property owners. It determines whether a particular piece of property can be developed or not because its proximity to a proposed structure can predict that structure's possible risk from floods and storms. The shoreline also establishes the international boundary off the coast of a nation and determines the extent of that country's legal jurisdiction." The shoreline is established by determining the mean high-water mark. With more than 95,000 miles of ocean and Great Lakes coastline, NOAA's coastal management responsibility is extensive. Light Detection and Ranging (LIDAR) is a remote sensing system used to collect topographic data. It is particularly useful in shoreline mapping because it is faster and less costly than traditional beach surveying methods. To make its measurements, a LIDAR sensor pulses a narrow, high-frequency laser beam toward the earth through an opening in the bottom of an aircraft. The sensor records the time difference between the emission of the laser beam and the return of the reflected laser signal to the aircraft. LIDAR data can be viewed in a GIS as a point, grid, or contour data set. Elevation data is best viewed in a grid format, which divides the area mapped into cells and assigns each cell a value based on the surrounding elevation points. The grid data set provides a smooth, continuous surface when displayed and allows the best opportunity for analysis, facilitating the management, analysis, and display of georeferenced data. NOAA has developed an extension to ArcView Spatial Analyst called the LIDAR Data Handler. It provides a number of options for the display and manipulation of gridded LIDAR data sets.
In addition to establishing the location of the national shoreline, NOAA does underwater mapping to determine a variety of features including the degree of salinity in a particular area, the location of specific marine habitats, and the extent and degree of coastal pollution. The protection of coastal waters from excessive pollution is another major responsibility of NOAA. Historically, most pollution control programs have dealt with single source pollution, which generally originates from manufacturing activities and sewage treatment plants. However, due to the effective monitoring and management of these facilities, a greater percentage of coastal pollution is now considered nonpoint, which occurs when rainfall or irrigation washes over the land, picks up pollutants, and carries them into watersheds and eventually coastal waters. Agricultural pollutants including fertilizers, pesticides, and animal wastes are particularly detrimental nonpoint sources of pollution to the coastal zone because the excessive nutrients within them stimulate the growth of algae and other plants and animals, which causes a depletion of oxygen ultimately killing off other animal life and poisoning the coastal waters. Nonpoint pollution is widespread and considered difficult to track and prevent. However, nonpoint pollution data models have been developed using ArcView with hydrologic modeling capabilities and have been successful in predicting the concentration and direction of pollution as it enters a watershed on its way to the ocean. A grid format is used that includes mean pollutant concentrations for predefined land uses in related cells. The model maps the effect from rainfall of the hydrologic loading and runoff of each cell and traces the flow of pollutants as they move from cell to cell and enter the watershed system. The decay of pollutants can also be simulated and depends on the distance from each cell to the nearest downstream point in the river. With a digital terrain model of the watershed, a flow direction network can be generated and the downstream values of average annual pollutant loads can be determined. By implementing ArcView technology, coastal pollution can not only be monitored but also potentially averted. "The average person really doesn't clearly understand the importance of the oceans to his or her well-being," observes Sylvia Earle, former chief scientist at NOAA. "The best hope for positive change is with an informed public, and GIS can play a significant role in the educational process. The future of humankind is absolutely dependent on the state of the ocean. Without its aquatic heart and soul, earth would be as barren and inhospitable as Mars." For more information, contact Cindy Fowler, NOAA (e-mail: Cindy.Fowler@noaa.gov). |
 With more than 70 percent of the earth's surface covered with water and more than 50 percent of the world's population living within 50 miles of a coastline, we are intrinsically tied to our oceans. The health and quality of life in our oceans directly affects our own health and quality of life.