Fall 2003
Fall 2003 |
|||||||
|
|
|||||||
Seaport Infrastructure Management in Russia and Ukraine Relies on GIS |
|||||
|
GIS is gaining momentum for use in infrastructure reorganization in Russian and Ukrainian transportation industries. In Ukrainian and south Russian seaports, GIS was successfully used to address problems varying from routine tasks to strategic planning. This article illustrates how GIS technology was successfully implemented in two major ports in Russia and one in Ukraine. Odessa (Ukraine)
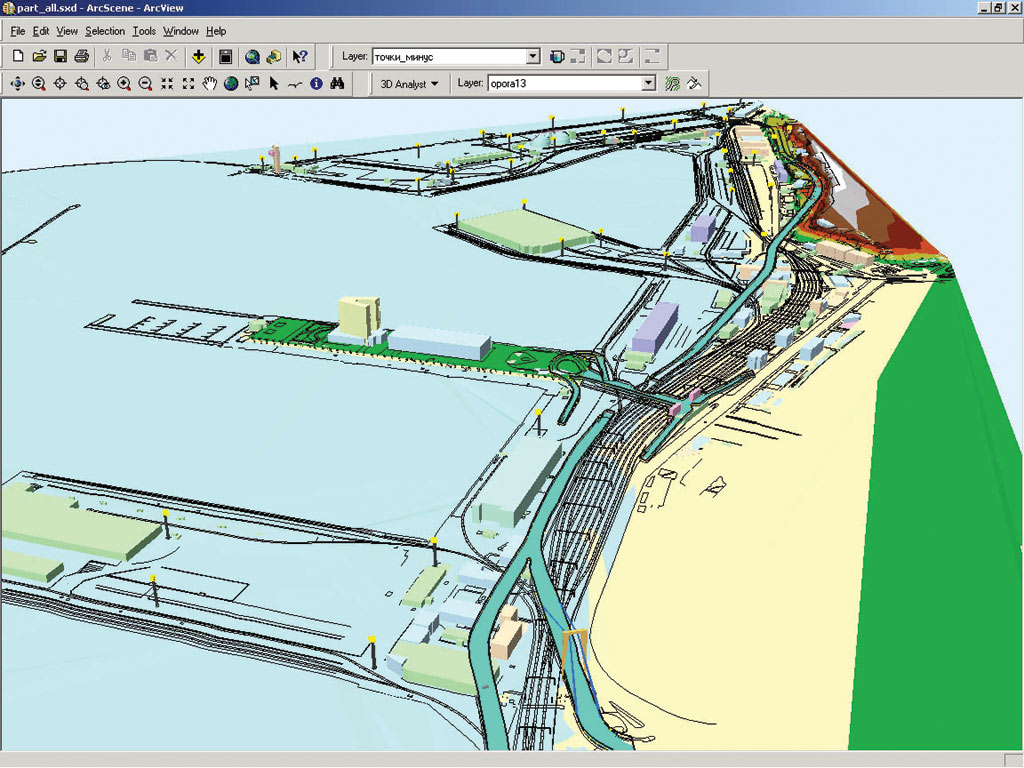
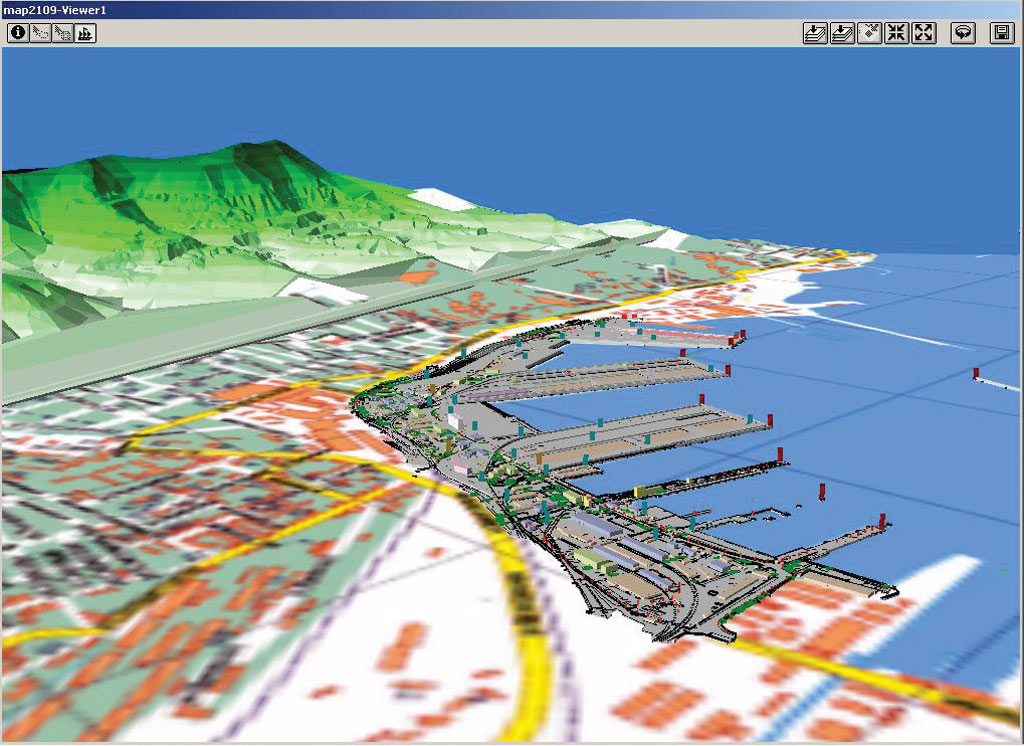
The Black Sea commercial port in Odessa, Ukraine, is a complex system that includes railways and multilevel automobile roads in addition to spatially intertwined underground surface networks and facilities. As the amount of data and documentation grew, analysts were having an increasingly difficult time managing the information, most of which had a cartographic component. Superior data quality was a necessity as it determined the efficiency of port authority decisions regarding port operation. The Odessa port saw the need for a GIS. Following a lengthy examination of possible GIS solutions, Esri distributor DATA+ (Moscow, Russia) was chosen to provide the Odessa port with the tools necessary to input and manage its complex set of data. The port GIS system, built using ArcGIS and the ArcGIS Spatial Analyst and ArcGIS 3D Analyst extensions, was created in stages and currently covers the port's entire territory. To ensure quality data, geodetic surveys were used to update the topographic basemaps. Data used for the project consisted of these digitized topographic maps (scale 1:500), technical documentation, geodetic survey results, and utilities' manhole data. With this information base, the GIS is able to provide dynamic query results regarding conditions, locations, and technical characteristics of buildings, structures, and engineering networks. The Odessa port is also able to perform spatial analysis of existing and planned engineering networks as well as to print maps at various scales automatically. The new system allows users to perform searches by object name, number, or coordinates or simply by clicking an object on the monitor. In addition, manholes now have hot links to added photos and videos. And a 3D representation of the port allows users to model automobile overpasses and overhead communications with regard to existing engineering networks. An object-oriented database includes information about objects within the engineering and communication networks as well as buildings in the port territory. Odessa's Black Sea port personnel are now able to perform analysis of depth data near quay walls and hydraulic structures, input depth data for surrounding waters and entrance passages, compare depth data against previous measurements, support data input alongside railroads, and present underwater and surface photos and videos of waterfront structures. The GIS system has proved very effective as an analysis and decision making tool in port infrastructure maintenance and development. It is fully compatible with the port's CAD system and provides high-quality paper maps. Taganrog (Russia)In the south Russian city of Taganrog, the Taganrog Bureau of Cadastre and Taganrog Sea Port Authority have worked together in the field of GIS for several years. Their projects included creating and maintaining routine inventory of port real estate using ArcView 3.2 and the ArcView Spatial Analyst and ArcView 3D Analyst extensions. These capabilities have allowed them to set up a digital model of the Taganrog bay floor, which allows port officials to monitor the entrance passages to the port. Such a wealth of accumulated spatial and attribute data has allowed the city of Taganrog to complete routine GIS tasks and illustrate complicated strategic planning solutions. One such solution was a response to seaport infrastructure changes called for by the Russian Federation Government Program for the Russian Transportation System Development. The program required switching export and import flows from Ukrainian ports to south Russian seaports and river ports. As a major port in the Sea of Azov, Taganrog was to play a significant role in these changes. However, the Taganrog seaport lacked facilities to accommodate the increased traffic and needed to be expanded. Obstacles to the expansion, such as an entrance passage that needed to be deepened, presented difficulties for various economic and ecological reasons. Also, the railway station nearest the port had only limited terminal capacity, and the port territory was squeezed between Taganrog's urban and recreational areas. For these reasons, Taganrog port authorities argued that moving the port to a new site outside city limits would be a viable option. The port's GIS capabilities were used to create an effective presentation to attract domestic and foreign investors to either the building of a new site or the expansion of the existing facility. Taganrog's Cadastre Bureau was given the task of illustrating both the advantages and disadvantages of each port development option. The client, Taganrog Sea Port Authority, requested that the presentation provide an interactive user interface, and support all major 3D scene manipulations as well as dynamic object querying. The GIS was used to support decision making and make a strategic choice between the two alternatives. The following are examples of digital maps presented to the Authority:
The Taganrog Bureau of Cadastre used a digital terrain model in GRID format in addition to IKONOS and KFA1000 satellite data. Land survey vector and port inventory data sets were also used, and ArcScene was used to create a 3D model of the territory. Since one of the client's requests was to create a model independent of GIS software, the ArcScene 3D model was significantly simplified and a new viewer application created. As a result, the demonstration was able to perform all basic scene manipulations, contain additional objects (such as lifting cranes and ships), and provide an interactive format. This project provides an important example of the successful use of digital data and GIS software. The Taganrog GIS system supported computer modeling and animation for a new, fully functional commercial product, providing decision making support and bringing investments into a major sea transportation hub. Novorossiysk (Russia)
In July 2000, the Center for Information and Computation of the Novorossiysk commercial port (Russia) created a complex automated system based on GIS technology that supports decision making processes for port authorities. The system was built using ArcGIS, ArcSDE, and ArcIMS and based on available digital data. The GIS system successfully integrates different port databases through unique object identification. Object selection queries are performed from various distributed port databases in real time. Acquired information includes technical documentation, building footprints, ownership information, etc. Data that changes quickly, such as cargo costs and stock, can also be acquired through the system. The GIS includes databases of different levels of aggregation, which depend on user needs. Also, the information hierarchy extends from the lowest levels (i.e., everyday dynamic information) to higher levels of strategic data that provide decision making support to port authorities. Base layers, maintained by the Center for Information and Computation, form the topographic base for the GIS system. These include data that does not change quickly in time and space. The thematic layers include data from various port services, which are responsible for data accuracy, storage, and maintenance. The software support for these projects was provided by DATA+, Esri's distributor in Russia. For more information, contact DATA+ (e-mail: market@dataplus.msk.su, tel.: 7-095-254-9335 or 7-095-254-6565, fax: 7-095-254-8895; Web: www.dataplus.ru). |