Fall 2005
Fall 2005 |
|||||||
|
|
|||||||
Helping Comply with the EPA's Clean Water Act
The State of Louisiana Develops Watershed Implementation Plans with GIS |
|||||||
|
Hurricanes Katrina and Rita have devastated the United States Gulf Coast region. The work described in this article was done before that disaster. As ArcNews goes to press, some of the individuals cited in the article are providing assistance to various agencies working on disaster relief and damage assessment including the U.S. Department of Energy, the U.S. Environmental Protection Agency (EPA), the U.S. Coast Guard, the Federal Emergency Management Agency, the National Oceanic and Atmospheric Administration, and the Texas Department of Environmental Quality. The effect of Katrina and Rita on the state's wetlands has been substantial, and GIS tools will be used to support the restoration efforts for the region. Situated in the southern United States on the shore of the Gulf of Mexico, Louisiana is a low-lying state with a diverse landscape that includes rolling hills in the north and bayous in the south. With a mean elevation of only 100 feet, Louisiana is traditionally home to a strong agriculture-based economy, which produces soybeans, cotton, sugarcane, rice, corn, and timber. Natural resource extraction includes oil and natural gas. This human activity on the land, combined with hot summers, low water flow, and sluggish bayou conditions, strains the state's capability to meet water quality standards established by the EPA Clean Water Act (CWA). The Act provides a structure for regulating pollutant discharge, surface water contaminants, and implementing pollution controls for United States water bodies.
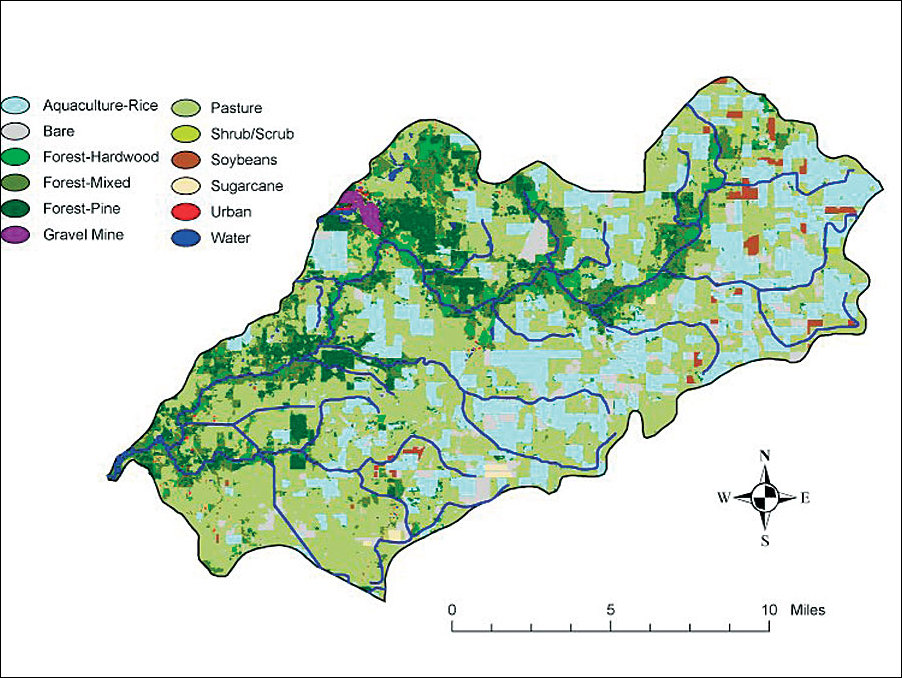
In addition, CWA requires that all states develop a list of impaired water bodies that do not meet water quality standards, even with current pollution controls in place. CWA also requires that a total maximum daily load (TMDL) be developed as a priority for each of these water bodies that is not meeting the designated uses (i.e., for fish and wildlife propagation and recreation). TMDLs establish limits for the pollutant load, from both point and nonpoint sources, that can be discharged into water bodies and still meet water quality standards and maintain the designated use(s). TMDL becomes the water quality management tool for establishing permit limits for point source discharges and load reduction goals for all nonpoint sources at the watershed level. U.S. EPA Region Six has a court-ordered schedule to complete all TMDLs for Louisiana by 2011, and the state is a partner in meeting that schedule. In 1999, the Louisiana Department of Environmental Quality (LDEQ) began using Esri's ArcInfo and Esri Business Partner Leica Geosystems' ERDAS IMAGINE software to devise a process for developing watershed implementation plans for the nonpoint source component of TMDLs. LDEQ has been using ArcInfo and ERDAS IMAGINE together since 1992. Jan Boydstun, senior environmental scientist at LDEQ, explains, "Due to the complexity in identifying the various sources of nonpoint pollution at the watershed level, LDEQ opted to use satellite imagery as the basis for land-use classification. Image analysis allows detailed information on crop types to be mapped for utilization in watershed models that can predict the specific locations of nonpoint source pollutant loading rates of sediment, nitrogen, phosphorus, and carbon to the bayou, lakes, or estuaries." The land-use classification begins with field sampling in designated watershed areas using USGS digital orthophoto quarter quadrangles as basemaps. Using Esri's ArcPad on Hewlett-Packard (HP) iPAQs, LDEQ's field crews collect land-cover attributes that are used as training fields and for accuracy assessment during the classification process. The field data from various crews is downloaded into ArcInfo running on HP workstations and combined into a single shapefile.
"We developed an algorithm that takes a 10 percent random stratified sample from our total population of data and sets it aside to be used for accuracy assessment later," explains John Sheehan, senior GIS analyst, LDEQ GIS Section. "Using this stratification process ensures that all data classes are represented." The remaining 90 percent of data points are then used during the image classification process. Landsat Thematic Mapper satellite imagery is preprocessed to convert the image to reflectance to correct for sun angle and seasonal differences. The imagery is mosaicked in the same path because adjacent paths are collected on different dates. "We have to be careful to keep the same dates together because the crops grown in the fields change throughout the growing season," explains DeWitt Braud, consultant to the Nonpoint Program and researcher at Louisiana State University in the Coastal Studies Institute. Using ERDAS IMAGINE, the data is stacked by date within the same path, and Principal Components, a process that prepares the data for classification by reducing noise and redundancy, is run independently for each path. The exact classification procedure is determined by field data and other variables. Tony Lewis, consultant to the Nonpoint Program and professor of geography at Louisiana State University in the Department of Geography and Anthropology, explains, "The field data can be used to define supervised training fields. Or we can run an unsupervised classification on the imagery and use the field data to identify spectral categories for use in the unsupervised classification. After we have defined the classification process in one of these two ways, we assess the accuracy using the 10 percent random sample collected from the original field data shapefile generated in ArcInfo." Braud clarifies, "We have a very specialized process for image classification, and it is refined each year depending on the image quality, the number of available images, and the area we are working in. We also use the weekly crop calendar provided by the Louisiana Department of Agriculture, which reports on crop status and the percentage of the crop that is at the expected growth stage. This enables us to easily separate and verify different crop types planted in the same fields throughout the year." The change in spectral signatures over time resulting from crop phenology during the growing season is the key to accurate imagery classification. The nonpoint load is different for each crop because fertilizer and pesticide applications and land management practices vary. Some crop practices have a greater impact on water quality than others.
Using ArcInfo, the classified image is used to create land-use maps that illustrate watersheds and crop locations and are included in watershed implementation plans. The classified image data is also prepared in ArcInfo for input into the Agriculture Nonpoint Source (AGNPS) model. Using ArcView, the LDEQ Nonpoint Source Unit runs the AGNPS model for use in the watershed implementation plans. The AGNPS model also generates a set of maps that is included in the watershed plans and the LDEQ Annual Report. "These analyses and maps enable the scientists to develop best management practices that could be a simple change, such as a farmer holding water for another week," states Paul Zundel Jr., IT/GIS deputy director at LDEQ. "If we know where the major problems are, then we can locate the crop fields in the watershed and address the issue." Boydstun states, "Nonpoint source pollution is the largest remaining type of water quality problem that all states are dealing with. In Louisiana, we have 12 river basins with 481 subsegments that represent the watershed level that TMDL is based on. Three hundred sixty-one of these subsegments are included on the list of water bodies that are required to have TMDLs developed by 2011. Most of our TMDLs are showing 50-85 percent load reduction of pollutants, such as sediment and nutrients, to meet our dissolved oxygen standard. By targeting the areas within the watershed of highest pollutant loading, resources can be utilized more efficiently for implementation of best management practices for agriculture, urban areas, sand and gravel mining, and forestry operations. By using GIS and image processing techniques, we are providing these operations with an objective scientific process, not a political process, for determining TMDL reductions." For more information on this project, contact Paul B. Zundel Jr., IT/GIS deputy director, Louisiana Department of Environmental Quality (e-mail: Paul.Zundel@la.gov, Web: map.ldeq.org); Jan Boydstun, senior environmental scientist, LDEQ (e-mail: Jan.Boydstun@la.gov); DeWitt Braud, consultant to the Nonpoint Program (e-mail: dbraud1@lsu.edu); Tony Lewis, consultant to the Nonpoint Program (e-mail: Tony.Lewis@la.gov); or John Sheehan, senior GIS analyst, LDEQ GIS Section (e-mail: John.Sheehan@la.gov). For more information on geospatial imaging solutions, contact Leica Geosystems (toll free in the United States: 1-877-463-7327 or outside the United States: 1-770-776-3400) or visit Leica Geosystems at gis.leica-geosystems.com. |