Fall 2008
Fall 2008 |
|||||||
|
|
|||||||
GIS Bolsters Recent Hurricane Response |
|||||
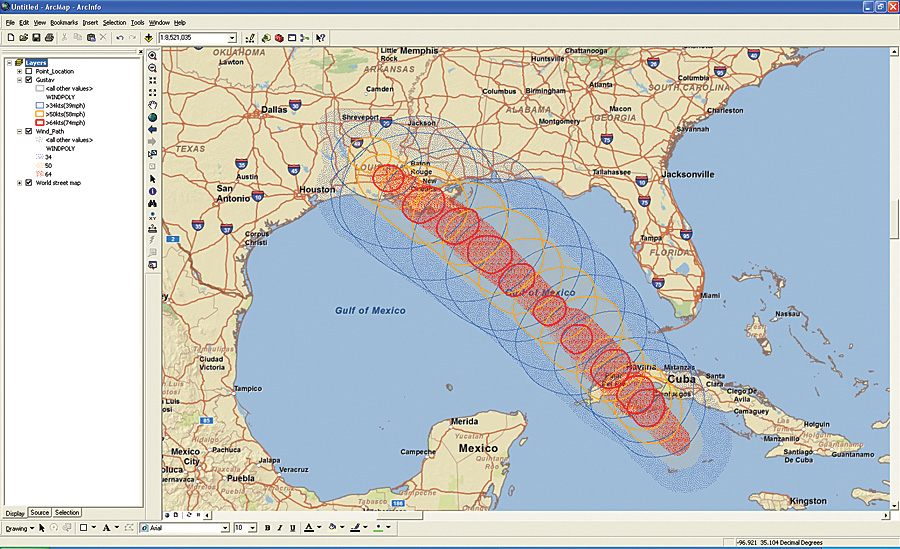
GIS technology played a key role in assisting U.S. federal, state, and local agencies to prepare for and respond to hurricanes Gustav and Ike. Using ArcGIS software and GIS Web services from Esri, staff from multiple agencies were able to more effectively prepare for the impact of both hurricanes. Officials viewed spatial and related tabular information to make assessments prior to the hurricanes making landfall. As the hurricanes swept across Mississippi, Louisiana, Texas, and Arkansas, dynamic data updates helped accurately depict events as they unfolded. "There's a lot going on at federal, state, and local government levels, as well as in private industry, that is GIS focused and provides great situational awareness for preparation, planning, and response," says Richard Driggers, director of the Infrastructure Information Collection Division, Department of Homeland Security (DHS). "Establishing relationships and partnerships to ensure a seamless approach is vital. I think teamwork in the GIS mission area is extremely important, and we saw a lot of that during Hurricane Ike and Hurricane Gustav." The Power of Hurricane GustavGustav, which made landfall as a Category 2 hurricane on Monday, September 1, was less potent than originally predicted but devastating nonetheless. Packed with winds exceeding 100 miles per hour (mph), torrential rain, and the threat of tornadoes, Hurricane Gustav resulted in U.S. property damages estimated in the billions of dollars. GIS helped mobilize responders, equipment, and supplies. It assisted in the evacuation of nearly two million people, including thousands of the elderly and infirm. In addition, spatial analyses were performed to understand how critical infrastructures might be impacted by the hurricane (potential power outages, transportation network impairment, government facility damage, etc.). From these analyses, contingencies were developed for maintaining government operations and business continuity using other resources. GIS analysts fused diverse data types from multiple sources, including satellite imagery; GPS coordinates; live weather feeds; and utility grid, parcel, and street information. Maps were developed after the hurricane hit that displayed damaged buildings and hazardous areas, functioning and downed communication networks, power outages, road closures, and food and safe water sources. These maps aided in identifying recovery priorities and communicating information to other government officials, the public, and the media. News outlets used GIS mapping to add data-rich graphics to their stories. Esri staff supported DHS officials in Washington, D.C., to produce maps and generate GIS Web services that disseminated data before, during, and after the incident. The Infrastructure Information Collection Division (IICD) of DHS is responsible for building risk and vulnerability information systems, databases, and assessment tools. The division also manages a program known as the Integrated Common Analytical Viewer (iCAV), which provides geospatial mapping of the nation's infrastructure that is accessible by authorized government and private sector organizations. IICD supported the Joint Field Office (JFO), located in Baton Rouge, Louisiana, during Hurricane Gustav and the JFO in Austin, Texas, during Hurricane Ike with data and critical infrastructure and GIS subject matter expertise. IICD also facilitated the development of dozens of different types of geospatial map products and supported GIS staff from other organizations working in the JFO. The division also helped coordinate remote-sensing efforts for aboveground infrastructure assets damaged during the events. IICD produced approximately 50 geospatial map products and 40 overhead imagery products in support of the response effort. "We work very closely with Protective Security Advisors (PSA) in the field who determine infrastructure priorities in terms of local or regional impacts," says Driggers. "As well as PSAs, local government agencies provided input through the JFO, which we use to build geospatial products. In addition to infrastructure data layers, we also integrate with different data sources, such as LandScan population count data; interdependency analysis models from the National Infrastructure Simulation and Analysis Center (NISAC); and NOAA's slosh model, which estimates the potential coastal impacts based on all the variables associated with terrain currents, wind forces, and direction. We also have standing requirements from our leadership that include a list of nationally significant critical infrastructure as well as other mission-related data layers." ArcGIS Desktop software—ArcInfo, ArcEditor, and ArcView—helped numerous public and private agencies collect, integrate, and build thousands of maps. ArcGIS Server, along with Esri-based GIS Web services, helped provide a fast, effective, and intuitive method for disseminating data and maps to numerous locations. The Production Line Tool Set (PLTS) for ArcGIS software suite, including the Job Tracking for ArcGIS extension, helped Esri staff track GIS tasks as they progressed through the completion process. GIS templates were put in place so that once the frameworks for GIS maps were established, they could be reused by simply adding new and updated data without having to completely re-create the map production process from scratch. Back to Back: Agencies Brace for Hurricane Ike
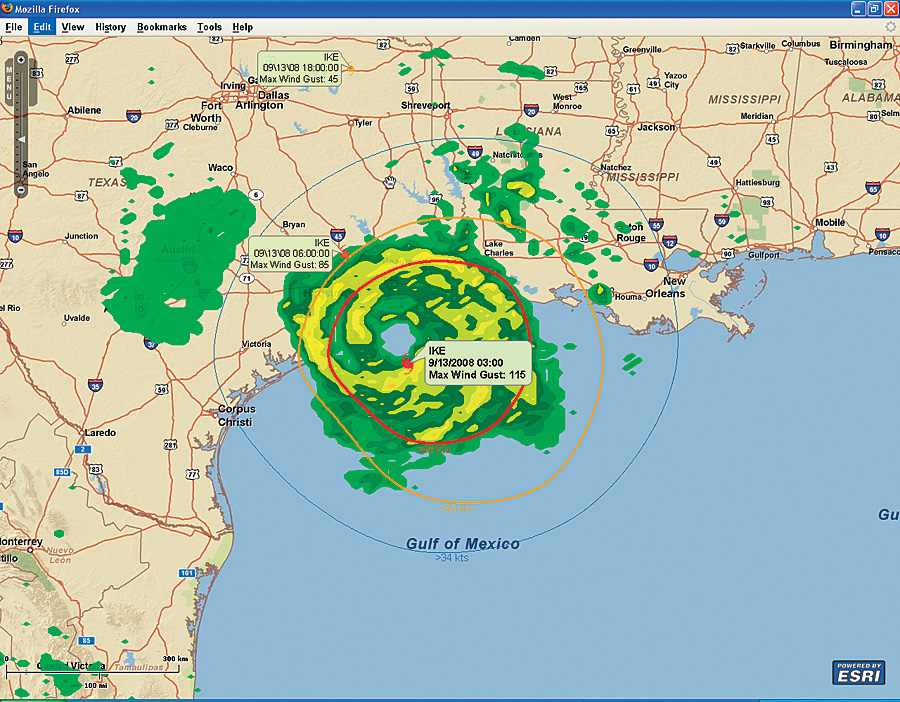
Just days after Hurricane Gustav struck, Hurricane Ike slammed into the Gulf areas of Texas and Louisiana. Ike made U.S. landfall at Galveston, Texas, on September 13 as a Category 2 hurricane with winds of 110 mph. The storm ravaged the Texas coastal area before moving inland and eventually north and west into Arkansas and beyond. As with Gustav, Ike readiness and response depended on accurately mapped data to place assets and people. Multiple agencies, including DHS, the Federal Emergency Management Agency (FEMA), the National Geospatial-Intelligence Agency (NGA), and the United States Geological Survey (USGS), managed immediate recovery efforts for Gustav while also engaging in response to Ike using GIS to map activities. "It's the old 'a picture is worth 1,000 words,'" says Greg Tune, lead program manager, geospatial technology, American Red Cross disaster services operations. "Whether it is through thematic maps or a point table map to show where our kitchen sites or open shelter sites are, those visuals really help our leadership understand what our service delivery is. It's getting up and running before the event. Then it helps us assess if we're in the right spot, if we have the right resources in place, and so forth." The American Red Cross worked in advance of the hurricanes to set up relief aid for millions of evacuees. For instance, it used GIS to help more than 900 shelters in Texas get up and running. With more than 350,000 overnight stays, maintaining adequate food, bedding, medical assistance, and other essential services was at a premium. Once these and other variables were identified and mapped, American Red Cross staff could better assist in maintaining their own services, as well as support state and county government agencies with their efforts. FEMA's National Incident Management Assistance Teams (N-IMAT)—two national Type-1 incident management teams developed after the Post-Katrina Emergency Management Reform Act (PKEMRA) of 2006—began working days prior to the first hurricane reaching land to provide mapping and remote-sensing support. The Geospatial Intelligence Unit (GIU), consisting of more than 15 GIS personnel for this event, brought in resources from various interagency groups, such as the National Geospatial-Intelligence Agency, United States Army Corps of Engineers, United States Coast Guard, and United States Forest Service. "Interagency coordination and working closely with the state and local GIS community are the keys to managing an effective response operation," says Joseph Toland, remote-sensing coordinator and GIU leader for the FEMA Western National Incident Management Assistance Team. "Disasters are managed with GIS by providing mission support for situational awareness and decision making to the interagency coordination group. These missions range from life-saving search and rescue operations and disaster medical assistance to damage assessments and long-term recovery programs designed to help individuals and families get back on their feet." Post-Hurricane Ike imagery was made available via ArcGIS Online Services, supplying ready-to-use content that could be easily added to other data. NOAA provided the data by carrying out aerial reconnaissance missions. Responders used the data for a vast array of decision-support activities. Citizens either directly affected by the disaster or interested in understanding the nature of the damaged areas could quickly and easily view the assessment maps. For both hurricanes, Esri actively assisted government agencies and private organizations responding to the disasters. A virtual disaster response team was assembled to organize a comprehensive user support outreach. Staff were deployed to government agencies to provide mapping and analysis activities. Technical support was offered 24/7 to handle any and all disaster-related requests. In addition, Esri staff contacted users in the affected areas to provide any type of software, services, hardware, and data support needed. "The objective of large-scale, complex emergency management is putting in place preparedness and prevention measures so that you minimize the impact of the event on people, communities, assets, and infrastructure," says Russ Johnson, public safety manager, Esri. "GIS helped do that. People were able to understand exactly what was happening and what actions needed to be taken both before and after the hurricanes made land." More InformationFor more information, contact Russ Johnson, Esri (e-mail: russ_johnson@esri.com). |