Spring 2008
Spring 2008 |
|||||||
|
|
|||||||
The Galathea 3 Expedition Included 48 Different Research Projects on Both Land and Water
Communicating Ocean Science with GIS |
|||||||
Highlights
Since the Vikings, Denmark has been known as a seafaring nation. In 1845, 231 sailors and scientists set off on a scientific journey, named Galathea 1, that would take them south around Africa to India, visiting Tranquebar and the Nicobar Islands. It was a tough journey, and 20 men lost their lives. The results of the expedition, which had been ordered by Danish King Christian VIII, were to be delivered in a beautifully decorated book, but unfortunately the king died shortly after the expedition returned, and the scientists argued so much that the book never became a reality.
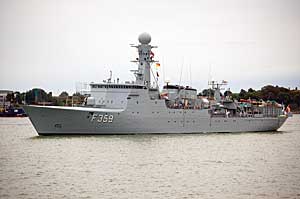
Where the first Galathea had support from the king, the second got it from the public. In 1952, when the deep-sea expedition Galathea 2 returned to Denmark after two years, 20,000 Danes greeted it at Langelinie quay in Copenhagen. The main reason for the support was that the forces behind the expedition had understood the power of communication. Reporters and journalists were onboard the ship, and every week movies about it were shown in the local theaters. In 2006, the Galathea 3 expedition began a nine-month-long research journey at sea. This time, the expedition had the support of both the public and royal family. Frederik, the Crown Prince of Denmark and protector for Galathea 3, while introducing the expedition at the Geological Institute in Copenhagen before the ship sailed off, said, "As individuals, we all have a curiosity to explain and demystify. We want to know, explain, and tell all what we experience as humans." This time, GIS technology also played a part in the expedition's objective to strengthen Danish research and make young people more interested in the natural sciences. Ship Information System Integrated with GISThe Galathea 3 expedition included 48 different research projects on both land and water. Most of the projects were carried out on the 112.5-meter-long expedition ship, Vædderen (the ram). The National Institute of Aquatic Resources at the Technical University of Denmark (DTU Aqua) was brought in to transform the Vædderen from a surveillance ship to a modern research ship. The many different research projects included examining Greenland's current and historic climate and its geological development and following the European eel on its journey from Europe to the Sargasso Sea, south of Bermuda. To collect background data for the many projects on board the ship, DTU Aqua developed—among other things—a Ship Information System (SIS) customized for the expedition. The development of SIS was based on experiences from previous voyages with DTU Aqua's own research vessel R/V DANA, but for the first time SIS was integrated with GIS. With the previous version of SIS, prior to integration with GIS, scientists onboard a ship could monitor and visualize their collected data. Through SIS, navigation data, such as position and depth, could be viewed. Weather data (temperature, wind, etc.) was recorded, and the ship used a water intake system positioned approximately five meters below the ocean surface that measured salinity, water temperature, and more as the ship sailed along. Scientists could visualize data in 2D and tables, and the data was automatically related to a GPS point in SIS.
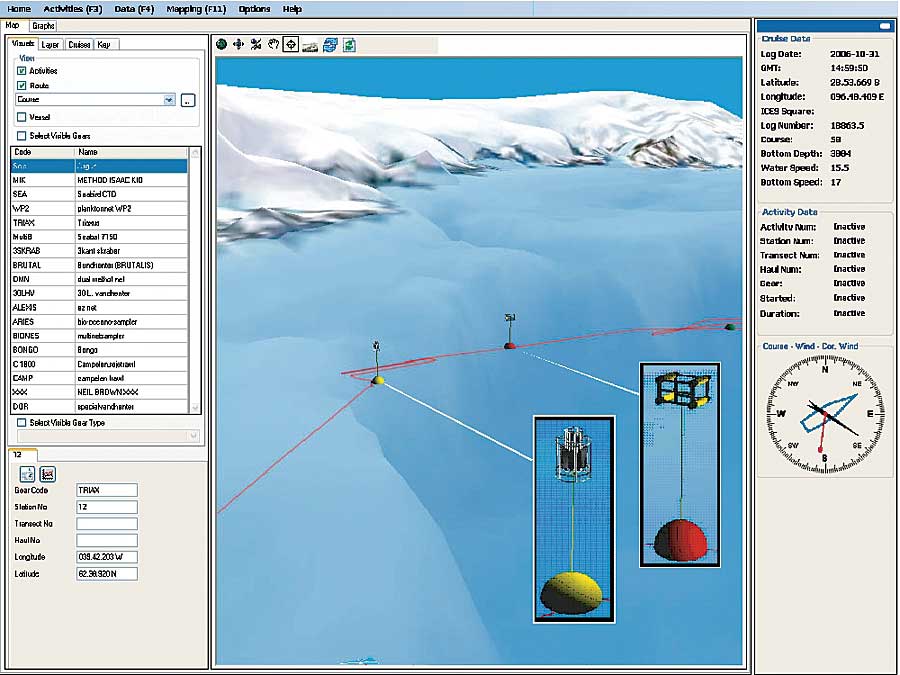
But, by supplementing SIS with GIS and geography, data is displayed in a much more intuitive way. DTU Aqua developed the customization using ArcGIS Engine 9.1 and the ArcGlobe application in 3D Analyst to create a mapping tool that made it possible to display the route and vessel on a globe in 3D at both its current position and its direction. The instruments used by the researchers could be viewed in 3D as well, related to the place where they were employed. ArcGIS software was already implemented and used day-to-day at DTU Aqua, so when the task of preparing Vædderen for its scientific journey arrived, the choice of GIS technology was easy. The IT developers at DTU Aqua were already familiar with the ArcGIS interface, and the data formats matched. Another reason for choosing ArcGIS was that SIS was programmed in C#, which can also be used with ArcGIS Engine. By choosing ArcGIS technology, the diverse needs were fulfilled. With ArcIMS, DTU Aqua could update data live on the Internet. ArcSDE was used to store the data shown in ArcIMS and ArcEditor and to integrate both the background data and new data from the ship. With ArcGIS Engine, data could be visualized on a globe through the SIS application. The Geographic EntranceThe mapping tool became a geographic entrance to searching, viewing, and analyzing the data, giving a new intuitive access point to the data. Combining GIS with SIS opened the opportunity to monitor the quality of the data acquired in near real time, thus making it possible to quickly discover problems, such as sensor malfunctions or activities performed at erroneous locations, and correct them. Working under sometimes difficult conditions with heavy seas, the scientists found the ease of SIS/GIS a great help. Near Real-Time Data
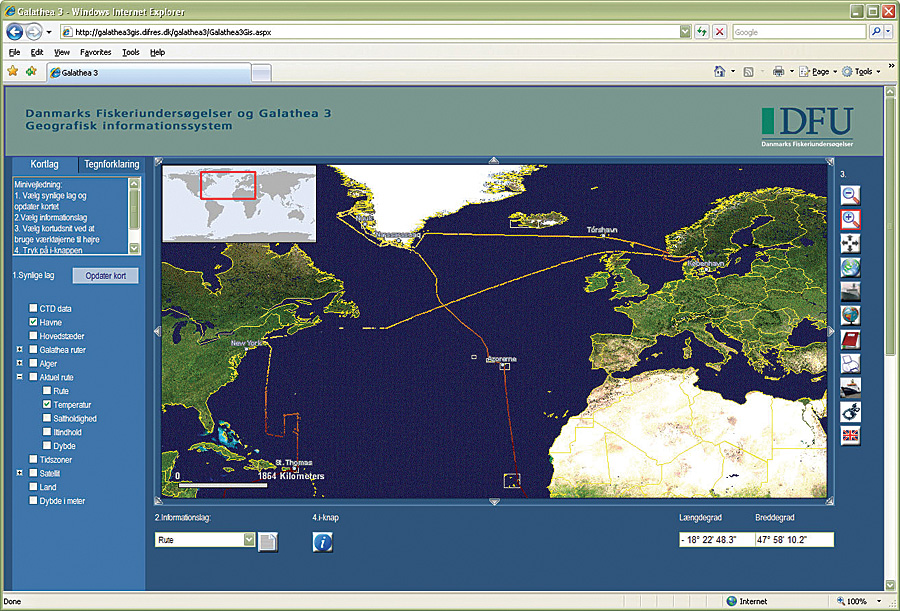
The information gathered by SIS/GIS was also communicated to the public via a Web site developed by DTU Aqua using ArcIMS. Data was sent from a server on the ship via a satellite connection to a server at DTU Aqua every hour. The Web site then showed the route and displayed satellite images showing the landscape when the ship was close to land. It was the first time a Danish expedition could be followed as it happened. The information from the water intake system, for instance, was also rendered nearly live via the Internet through ArcIMS at DTU Aqua. The ResultsScientists are still working on analyzing the vast amount of data collected on the expedition. The Galathea 3 expedition is well known by the Danish public—a survey shows that more than 80 percent of the public have heard about the expedition and that more than 60 percent thought it was a good idea to let research, science, and communication go hand in hand. More InformationFor more information, contact Kerstin Geitner, GIS coordinator, Technical University of Denmark, National Institute of Aquatic Resources (tel.: 45-33-96-33-54, e-mail: kjg@aqua.dtu.dk, Web: www.aqua.dtu.dk/English.aspx), or Sofie Hermansen, communication specialist, Informi GIS (tel.: 45-39-96-59-09, e-mail: sofieh@informi.dk, Web: www.informi.dk). |