Spring 2008
Spring 2008 |
|||||||
|
|
|||||||
Causes Analyzed with GIS—Geology and Geomorphology Probed
Landslides Studied by Japan Researchers |
|||||||
Highlights
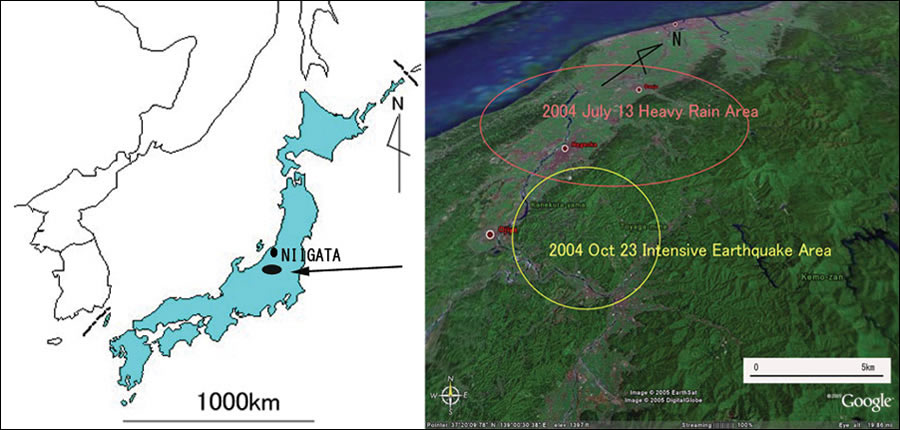
Mountainous, rocky terrain is characteristic of Japan's landscape. Also characteristic of Japan are frequent downpours and severe earthquakes. In the summer and fall of 2004, this combination created ideal conditions for an October series of landslides in the mid-Niigata region. Specifically, the heavy rainfall on July 13 flooded two major branches of Japan's longest river, the Shinano-gawa, and three months later, on October 23, intense earthquakes rocked another hilly area just south of the area of summer rains, triggering about 4,000 landslides. Using GIS technology to analyze these landslide triggers, so common for mid-Niigata and the rest of Japan, were Hiromitsu Yamagishi from Niigata University, Junko Iwahashi from the Geographical Survey Institute, and Toko Takayama from Asia Air Survey.
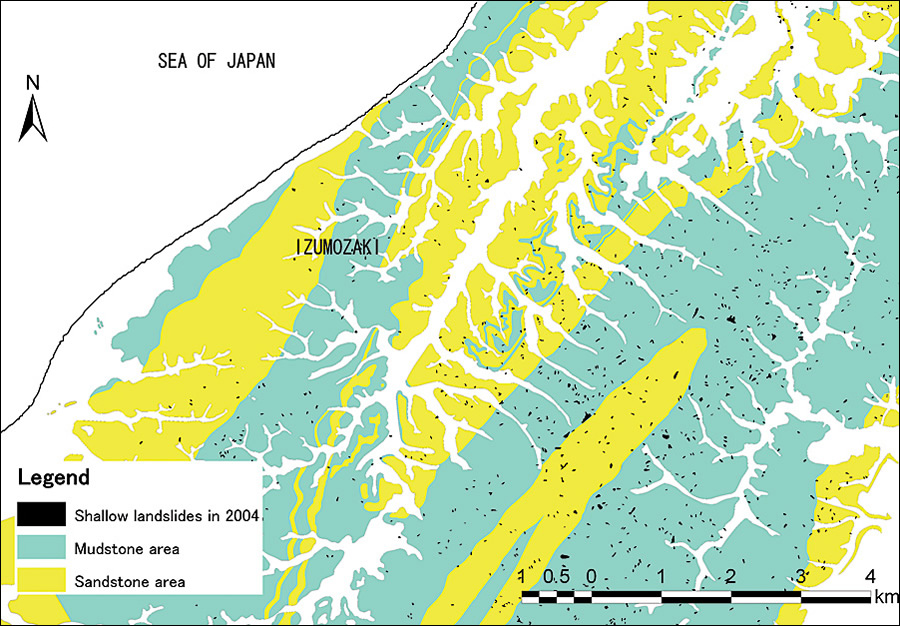
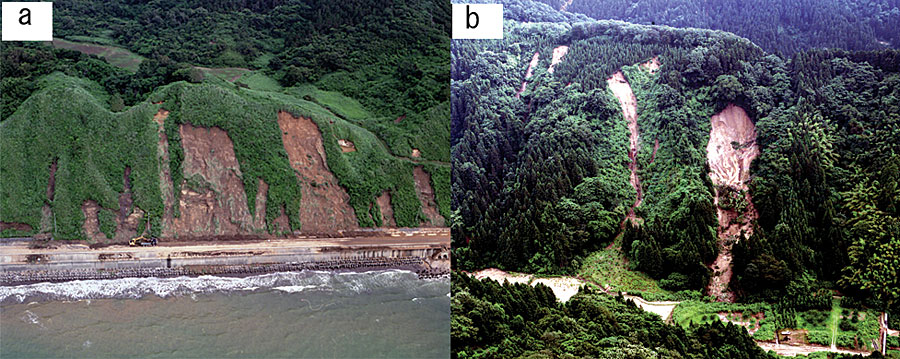
"Different triggers brought about the various landslides in the hilly mountains," the research team writes in its analysis. "Therefore, these two events [of July 13 and October 23] are very useful for clarifying the difference in features of the landslides between the two events. We have been researching both landslide [events] in the field, just after both occurred, and later analyzing air photographs using GIS." In their analysis, the researchers used ArcGIS Desktop software (through Niigata University's Esri University Campuswide Site License Program) and geological data sources to explore the number and severity of the landslides in relation to their being rainfall or earthquake induced. GIS is used to generate thematic maps, which help illustrate patterns that a researcher might not be able to easily identify by just looking at data tables. The team also used GIS maps to see if the area's geology and geomorphology, or landforms, played a part as well. By mapping and charting the two landslide triggers and geological features, the researchers were able to visualize what affected the density and severity of the landslides, providing valuable findings that could be used for future disaster mitigation. Izumozaki and Tochio: Rainfall-Induced LandslidesTo begin examining how many and what type of landslides the heavy rainfall caused, the researchers looked at the July 13 precipitation level for mid-Niigata's Izumozaki and Tochio regions. The Automated Meteorological Data Acquisition System (AMeDAS) station in Tochio City recorded almost 17 inches of rainfall starting the evening of July 12 and ending early the next day. The team prepared GIS precipitation and contour maps of the area (approximately 777 square miles) depicting the landforms and identifying the flooding and landslides caused by the rainfall. Both deep and shallow landslides, as well as long mudflows up to several hundred yards in length, were made visible with colored lines indicating the type and size of the event. Most of the landslides were shallow, several yards wide and thick, and some were in close proximity to the mudflows.
With ArcGIS, a slope map was produced with landslide data from the National Research Institute for Earth Science and Disaster Prevention (NIED). The researchers could see from this map the number of rainfall-induced, shallow landslides in relation to older landslides virtually frozen in the earth. The region's hilly mountains are shaped by former events—old, deep-seated landslides that create slopes in the land, as seen in the team's stratum-dipping contour maps. The maps revealed that the rainfall-induced landslides were concentrated in these steeply sloped areas. Surface materials were also considered in the analysis. A geological map modified with GIS was used to see how the rainfall-induced landslides differed in number depending on the area's geology. The affected region has a fairly equal amount of sandstone and mudstone surface material. However, where there was mudstone, there were more landslides. When it comes to rainfall-induced landslides, the team's ArcGIS analysis unveiled some important observations related but not restricted to the July 2004 downpour. First, most of the Izumozaki and Tochio landslides were shallow rather than deep seated. Second, almost all the deep-seated landslides were closely associated with long-run mudflows. Also, the majority of landslides occurred along the ridges. Lastly, mudstone surfaces experienced more of the rainfall-induced landslides than the sandstone. These findings not only provide a better understanding of rainfall-induced landslides, but they also convey what geology and geomorphology are less safe for building roads and communities. Yamakoshi: Earthquake-Induced LandslidesOn October 23, 2004, the southern region of mid-Niigata was struck by an earthquake registering 6.8 on the Richter scale. A map created using ArcGIS was again used to compare landslide density in sandstone- versus mudstone-rich zones. The researchers found something different this time. The landslides caused by these earthquakes and aftershocks were concentrated along the mudstone and sandstone surfaces.
Once more, the team turned to the contours of the land to further study the earthquake-induced landslides. A topographic contour line map, layered with a geologic stratum-dipping contour map, again showed a higher number of large-scale landslides in the areas of gentle stratum dipping. Also, when it came to the earthquake trigger, not only did the gradient affect the amount of large-scale landslides in the area, but the earthquake-induced shallow landslides were actually larger on steeper slopes. Some of the October 2004 landslides were thought to even be accelerated as they ran their course. The hilly earthquake areas contain numerous paddy fields, flooded parcels of arable land used for growing rice. The researchers suggested that landslide flow could easily gain momentum by mixing with water from the paddy fields and ponds. GIS analysis did show a relationship between cracks caused by the earthquakes and paddy fields and ponds with or without water. Yamagishi's team found both contrasts and similarities when comparing the earthquake- and rainfall-induced landslides. Mudstone, rather than sandstone, became the unstable surface during rainfall; more earth-quake induced landslides overall were shown to occur in the sandstone-rich areas. In addition, water standing in surrounding paddy fields was also shown to create unstable terrain. Regardless of what triggered it, a landslide that mixes with water can gain deadly momentum. The earthquake trigger in Yamakoshi proved just as dangerous as the rainfall in Izumozaki and Tochio. Where the rainfall occurs or earthquake hypocenter is located, what geology is involved, and whether there are steep slopes or paddy fields nearby, each affects how many and what types of landslides can occur. Yamagishi, Iwahashi, and Takayama used GIS to reveal these observations. Their work has shared vital information with their fellow researchers, the residents of mid-Niigata, and decision makers concerned with managing landslide hazards. More InformationFor more information, contact Hiromitsu Yamagishi, Niigata University (e-mail: hiroy@env.sc.niigata-u.ac.jp). |