Winter 2006/2007
Winter 2006/2007 |
|||||||
|
|
|||||||
Decommissioned Army Ammunition Plant Modeled with GIS
Defining Soil Remediation Scope and Budget |
|||||||
|
By Jeffery M. Laird, GIS Manager, Badger Army Ammunition Plant
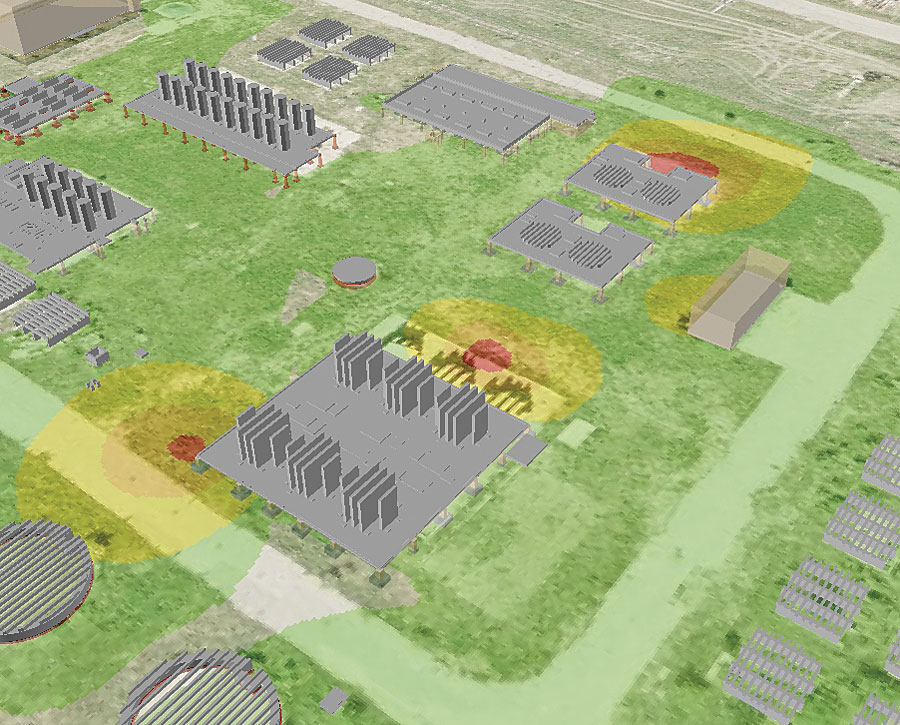
The Badger Army Ammunition Plant (AAP) in Baraboo, Wisconsin, was built in 1941 and produced ammunition, ordnance, gunpowder, and propellant for the United States Army until 1975. In the late 1990s, the government decided to decommission Badger AAP and transfer the land to other government agencies. Subsequent surveys detected various hazardous compounds in the site's structures, soil, and groundwater, which must be remediated according to Wisconsin Department of Natural Resources (WDNR) and federal Environmental Protection Agency (EPA) guidelines. This remediation process is ongoing. Historical LimitationsResources for the environmental remediation of contaminated soils are historically limited. Therefore, excavation should be focused only on those areas where it is necessary, minimizing the removal of surrounding collateral uncontaminated soil. Environmental managers and geologists use GIS software to build 3D models for decision making and presentation tasks inherent in defining a project with an accurate scope and budget. Project managers use GIS to create baseline maps for evaluating contractor bids. GIS can document processes and provide spatially accurate models for projecting the cubic yards of earth and concrete that need to be removed in remediation efforts. GIS technology has proved to be a mission-critical element of remediation activities. A GIS project was established at Badger AAP in 1999 to support scientists and engineers involved in site remediation. GIS also supported army and contractor staff in communicating spatial information to management, command personnel, and concerned citizens groups and to provide sophisticated spatial modeling and analysis tools, decision-making tools, and mapping products for the user community. The current Badger GIS consists of ArcInfo, ArcIMS, ArcGIS 3D Analyst, and ArcPad software. The entire GIS operation is outsourced to Grand Terre GIS of Frankfort, Kentucky, an Esri Business Partner. One nine-acre remediation area has been demolished to its concrete foundations with the exception of a few remaining buildings. Although soil contamination is relatively shallow, it is located near hard-to-access locations of concrete slabs, support columns, and footings.
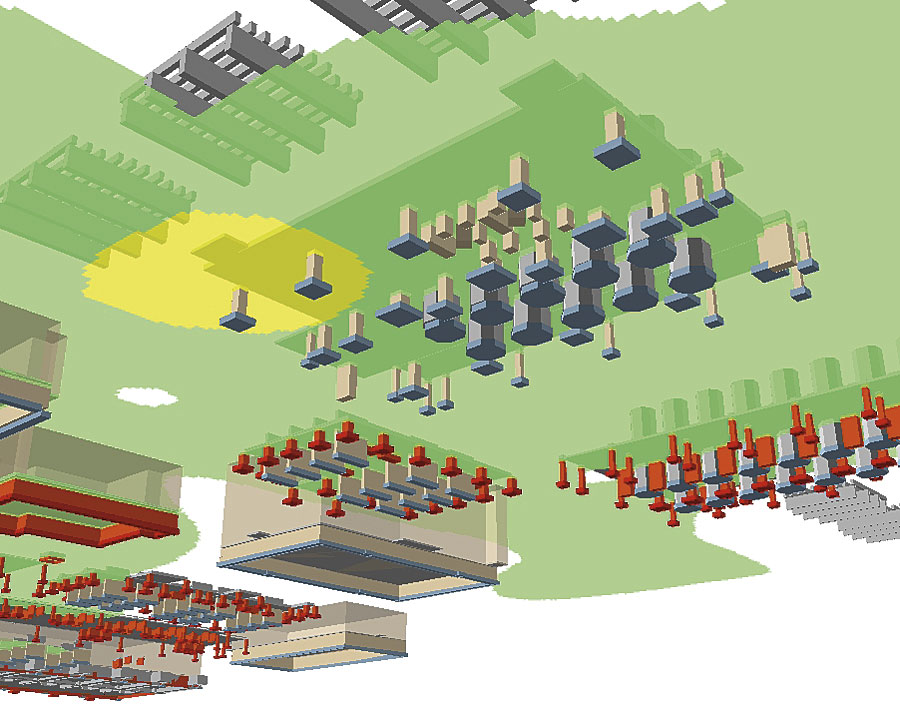
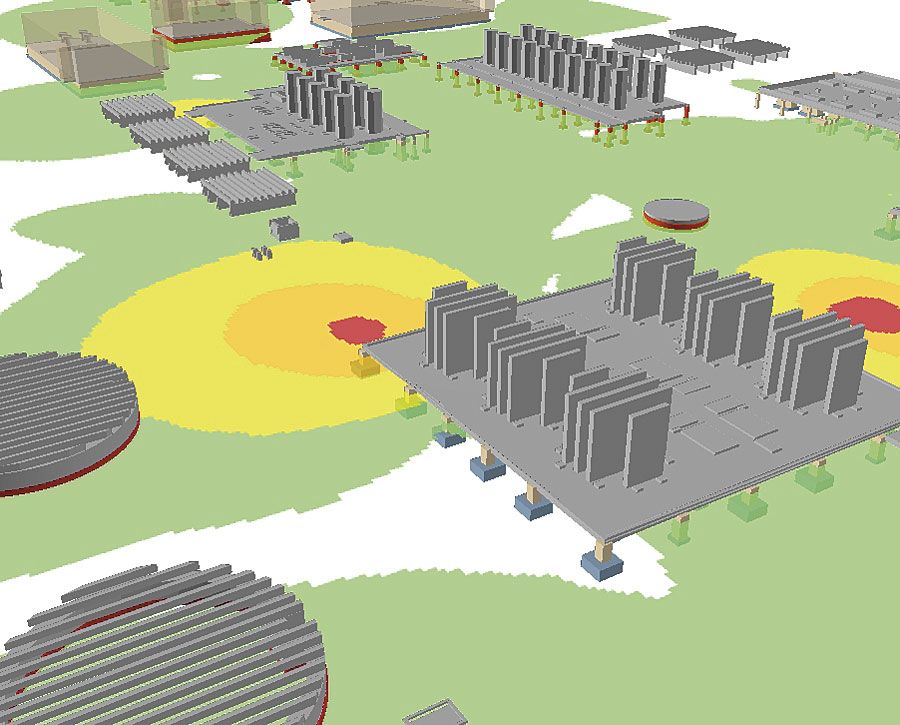
It is most cost-effective for the army to have only the contaminated soils removed. Where concrete foundations exist within the contaminated areas, the concrete must also be removed, which is more expensive than soil removal. Some concrete foundations were as much as eight feet deep, which complicated the process of ascertaining an approximate cost for excavation. A Three-Dimensional ViewManagers needed to see a three-dimensional view of both contamination and concrete. Contamination data was overlaid onto the concrete foundations data and volume information so that the amount of concrete and soil to be removed could be calculated. Then costs and level of effort for the project were projected. To determine the extent of contamination, geologists needed to see where the contaminated area boundaries were and how the concentrations were distributed. They performed multiple borings and took soil samples at several depths. The positions of the borings were recorded using ArcPad on a Thales MMCE GPS with submeter accuracy. These points were supplied to the GIS manager who plotted them against a basemap of the site. GIS was used to create a triangulated irregular network (TIN) of the site area. Then a surface of contamination was created using the depths of the samples with contaminant "hits." Next, a nearest-neighbor algorithm within ArcGIS 3D Analyst was used to determine the contaminated area based on the boreholes and their resultant values. The results were projected onto the contaminant surface TIN and assigned a thematically colored legend based on concentration value. Values below the WDNR threshold for remediation were discarded, and the final result was a spatially accurate three-dimensional model of the extent of contamination. As a last step, geologists decided that because no contamination results were deeper than two feet, and that two feet was the maximum depth that an excavation would go, it was not necessary to project onto a contaminant surface TIN. It was easier to assign the contaminant model a uniform offset of negative two feet off the site surface TIN. ModelingA model for concrete data also had to be created, and data needed to be digitized so that it could be used in the GIS. When the site structures were built from 1941 to 1942, each structure was documented with an as-built engineering drawing done by civilian draftsmen working for the army at the time. These drawings still exist on paper and microfiche, but both sources are in very poor condition and, in some cases, illegible. These were the source maps for modeling the concrete. Foundation structures were categorized into three basic categories: slabs (including on-slab structures, such as motor pads), support columns, and footings. Shapefiles were created for each category. Working from the as-built sources on a building-by-building basis, the two-dimensional geometries (length and width) were digitized using the precision entry tools of ArcInfo. The length, width, and height values were then entered into the attribute records of each separate structure, along with depth offset values. Other descriptive data about the building was also included in the model for future use. Digitizing data for the 16 buildings and 32 tanks in the project area took approximately 90 hours.
When feature digitizing and attribution were finished, the three shapefiles were attached to ArcGIS 3D Analyst extension's ArcScene application along with some road, building, and tank information that was clipped from the main feature classes residing in the Badger AAP geodatabase. The site TIN derived from contour and spot height elevations was added. The footings, columns, and slabs were then assigned base heights of the TIN and the individual features extruded according to their height values, beginning from their offset value in relation to the TIN's base height. Slabs were extruded in a positive direction, and footings and columns were extruded in a negative direction, placing them below the surface. In areas where the source maps were in condition too poor to derive dimensions, surrogate data was used based on the geologist's knowledge of foundation construction. Where surrogate data was used, the subsurface features were assigned orange and red coloration. The result of all this data input was a fully rotatable three-dimensional model of the subsurface foundations, spatially accurate and precisely to scale in ground units. Because each feature had length, width, and height attributes, the field calculator could be used to easily determine and populate a volume field. If features were circular or hexagonal, the relevant solid's geometry formula was used to derive volume. The contaminant extents model was added to ArcGIS 3D Analyst to create maps that show where the contamination intercepted the concrete. These concrete features were then selected by location, and the sum of their volumes was added to the volume of contaminated earth to be removed. At this point, environmental management had the information it needed to compile a budget and a project description for the army to consider. They also were able to spatially illustrate concepts, such as contaminant locations in relation to concrete subsurface features and slabs, and provide views into the model from any angle at any scale. About the AuthorJeffrey M. Laird is the GIS manager at Badger AAP and president of Grand Terre GIS. Mr. Laird is an American Society for Photogrammetry and Remote Sensing (ASPRS) Certified Mapping Scientist, a GIS Certification Institute-certified GIS professional; and a member of ASPRS, the National Association of Environmental Professionals, and URISA. More InformationFor more information, contact Jeffrey M. Laird (tel.: 502-695-5676, e-mail: grndtgis@earthlink.net, Web: www.grandterregis.com). |