Winter 2007/2008
Winter 2007/2008 |
|||||||
|
|
|||||||
Total Enterprise GIS in City Government |
|||
|
By Mark Hochstein, GIS Coordinator, City of Sugar Land, Texas Highlights
Founded as a sugar plantation in the mid-1800s and incorporated in 1959, the City of Sugar Land is located in Fort Bend County 20 miles southwest of downtown Houston, Texas. It is a diverse community with excellent job opportunities and affordable housing. The city's economy has had a 31 percent job growth rate during the last five years. In 2006, Sugar Land was ranked the third best place to live in America by Money magazine and CNN/Money. Sugar Land is a full-service municipality providing the highest quality of affordable services to meet the needs of its citizens. Master-planned communities and welcoming neighborhoods enhance home values and create a sense of belonging. The community offers outstanding schools, libraries, civic organizations, and other resources that make Sugar Land a great place to work, live, and raise a family. Sugar Land's low crime rate and strong health and education indexes all contribute to high marks for quality of life.
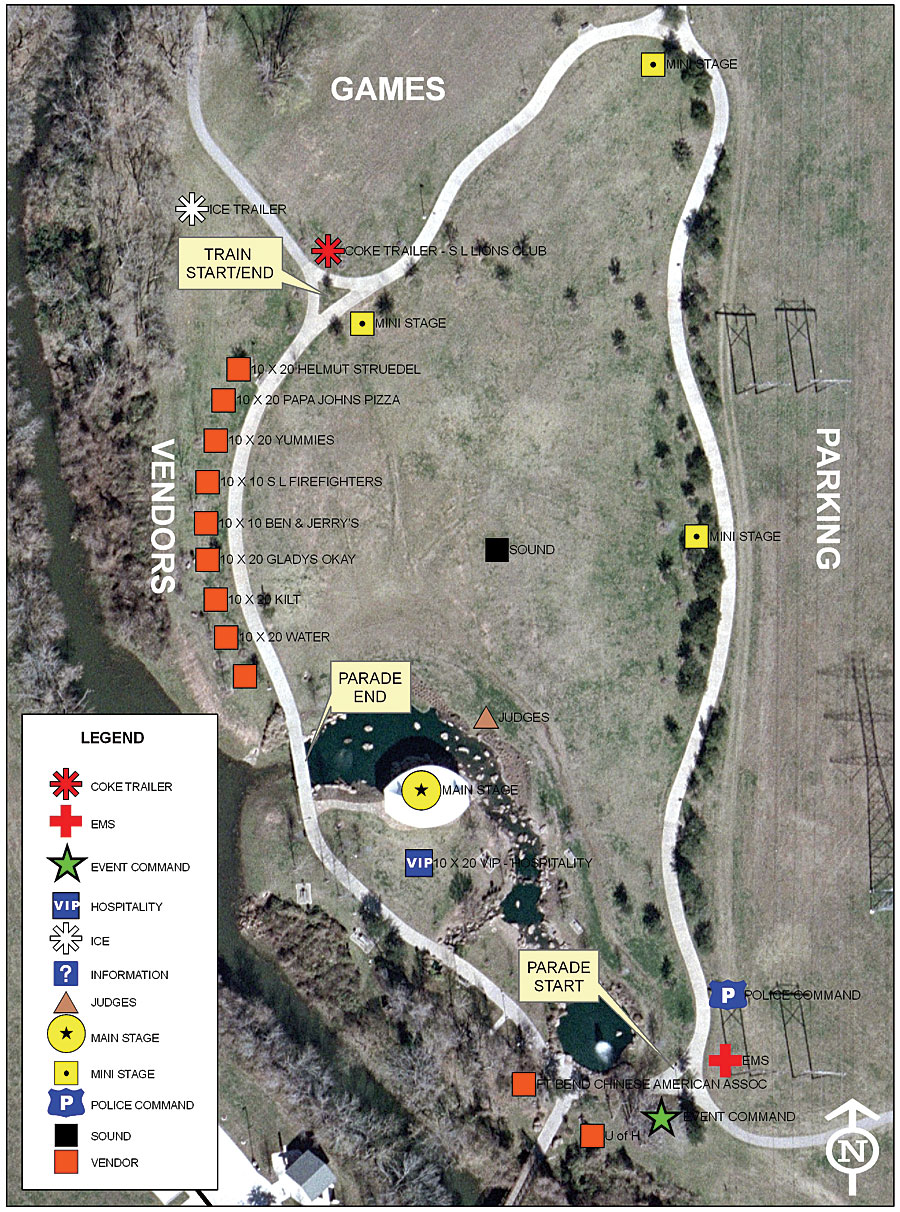
The city began using GIS software from Esri in the mid-1990s, and GIS has played a behind-the-scenes role in Sugar Land's success. Today, the city's enterprise GIS is utilized every day by both citizens and city employees in many ways. GIS is used to design and maintain city infrastructure, field service calls, dispatch emergency vehicles, provide information to the public via the Internet, plan neighborhoods and parks, and much more. Because Sugar Land is in one of the fastest-growing areas in the state of Texas, it is required by the Department of Justice to redistrict its existing council districts by population as new large residential areas are annexed into the city. ArcGIS, along with a districting extension, allows this task to be performed in-house, whereas prior to using GIS, redistricting was a costly process the city had to outsource. On Sugar Land's Web site, the public utilizes a program created with GIS that the city calls My Neighborhood (www.sugarlandtx.gov/sugarland/gis/index.asp). My Neighborhood provides city residents with the ability to access service information specifically for their address and neighborhood without displaying a map. This capability makes finding city offices and services for particular addresses as easy as clicking a mouse. The program sorts through geodatabases, bringing up links to city offices and neighborhood services pertaining to any given address within the city. Examples of the information available are trash pickup dates, mosquito spraying schedules, homeowner associations, city representatives, police bulletins, nearby parks, city facilities, and capital improvement projects located within one mile of or associated with the address. ArcIMS is used on Sugar Land's Web site to provide an interactive map site that presents current maps and data to the public. Sugar Land's interactive maps provide public access to maps of council districts, parks, voting precincts/polling locations, zoning districts, aerial photography, and more. These maps allow users to look up street addresses and perform queries. Some of the interactive maps have specific uses and benefits, such as the GPS/Benchmark Map. This map allows surveyors to locate benchmarks within the city and download specific criteria for individual benchmarks. Prior to the availability of this online map, surveyors had to visit city offices and have a city employee locate and provide the data. The online map not only saves the surveyor time but also saves city employee time. The city utilizes custom map books created in-house with ArcGIS Desktop and a map book extension. Versions of the city's map book are placed in all city emergency response and Public Works vehicles. Fire Department versions of the map book include fire hydrant locations, enabling first responders to plan beforehand where to connect hoses. A PDF version of the city's map book is available as a free download from the city's Web site. Delivery drivers and small businesses are able to utilize Sugar Land's map book to locate the newest streets in the city, which are usually not available on any other published map. Sugar Land Fire Department utilizes the ArcGIS Network Analyst extension to plan fire station response areas and future station locations. Using geographic locations of fire stations in relation to roadways, natural barriers, restricted turn movements, one-way streets, speed limits, distance, and more, GIS aids in creating fire response areas. The Insurance Service Office (ISO) utilizes this information, along with other city GIS data on water lines, hydrant locations, and water storage sites, when compiling data to determine the city's fire service rating. Providing an excellent ISO service rating reduces base insurance rates for citizens. GIS plays a critical role in public safety, as it is used to maintain the city's 911 emergency database for dispatching emergency response. The city's Police Department utilizes GIS to map crimes, locate crime hot spots, and perform pattern analysis. GIS is also used by the Police Department to create maps, such as the Registered Sex Offenders Map and the Drug Free Zone Map, that help justify increased penalties for lawbreakers caught in areas near schools and parks. The Police Department and municipal courts utilize GIS to create maps outlining accident and crime scenes. Digital orthophotography is used with GIS to create large aerial photo displays, bringing the scene of the crime into the courtroom. GIS provides the capability to generate maps on the fly in the city's Emergency Operations Center (EOC). During emergencies, GIS maps are used for strategy planning, evacuations, or just about any situation imaginable. Sugar Land uses the Environmental Protection Agency's (EPA) ALOHA software to create plume model footprints that can be imported into ArcGIS as an event, so an analysis can be performed on population impact. During the 2004 Super Bowl, GIS maps were utilized for planning the parking of aircraft on taxiways and other areas at Sugar Land Regional Airport. In the airport terminal, handout maps showing locations of hotels/motels and nearby restaurants were created with GIS. For the city's annual Fourth of July celebrations, GIS is used to select and communicate the locations of parking areas, vendor booths, shuttle bus routes, parade routes, and security. GIS is a crucial element in the Parks and Recreation Department's Hike and Bike Master Plan process as a planning tool. With the GIS, staff have the ability to look at what the city has in place, what is needed, and where connections can be made. In areas where the city is looking at potential trail connections, the GIS makes it easy to identify landowners so staff can discuss trail possibilities across their property. Knowing that safety and crime are major concerns of citizens, parks staff are able to acquire crime incident reports from the police and, with the help of the GIS, visually interpret if there are any correlations between existing trails behind houses and incidents, such as burglary. Sugar Land's Economic Development Department utilizes GIS to maintain a database on economic development projects and provide infrastructure information to potential developers. The department is currently implementing a plan to utilize GIS to identify and track available commercial properties, expand on commercial vacancy and absorption reporting, and produce retail and office data reports for new prospects as part of a recruitment and redevelopment program. The city's Planning Department uses ArcGIS for site plan reviews to view what exists around a proposed development and determine if the project will meet requirements of the Development Code. The Planning Department also uses GIS for zoning, tracking development, regional planning for future growth, and master plans. Estimated population growth is calculated with ArcGIS, allowing other city departments to use these estimates to forecast future budgeting and staffing needs. Engineering uses GIS to map drainage complaints and manage the floodplains and watersheds. With lidar information, ArcGIS is used in reporting and conducting ponding analysis to identify areas of concern with regard to drainage. GIS is also used for thoroughfare planning, property acquisition, right-of-way determination, and project impact. Within Public Works, GIS is used for capital improvement program development, utility line route analysis, right-of-way landscape and permit management, utility field surveys and inspections, tree trimming program management, utility system network improvement planning, and infrastructure management. GIS is also used in Public Works to manage roadway pavement, traffic signs, and sidewalks. The City of Sugar Land utilizes GIS in many different areas on an ever-increasing basis. Sugar Land's enterprise GIS helps the city plan for a strong local economy and provides its citizens with a well-planned community, livable neighborhoods, and enhanced public safety. About the AuthorMark Hochstein has been with the City of Sugar Land for 7 years. He has 15 years of GIS experience in land, planning, economic development, engineering, and public safety applications. Hochstein coordinates the City of Sugar Land's GIS program, overseeing projects associated with GIS. More InformationFor more information, contact Mark Hochstein, GISP, GIS coordinator, City of Sugar Land (tel.: 281-275-2781, e-mail: mhochstein@sugarlandtx.gov, Web: www.sugarlandtx.gov. |