Winter 2007/2008
Winter 2007/2008 |
|||||||
|
|
|||||||
Writing, Grammar, and Spelling—The Use of Text in Maps
Watch Your Language While Mapping |
|||||||
|
By Christopher Sellers Guest author Christopher Sellers offers his views on an often-neglected aspect of mapmaking. As the map is the major avenue of information between the geographer and reader, how well that information is conveyed will determine how well it is interpreted by the reader. This, in turn, will determine the reader's understanding of the topic presented. John Clarke summarized it aptly in 1959, suggesting that the mapmaker should "make every endeavor to present his data in such a way that the map reader gains an exact impression and makes an exact interpretation."
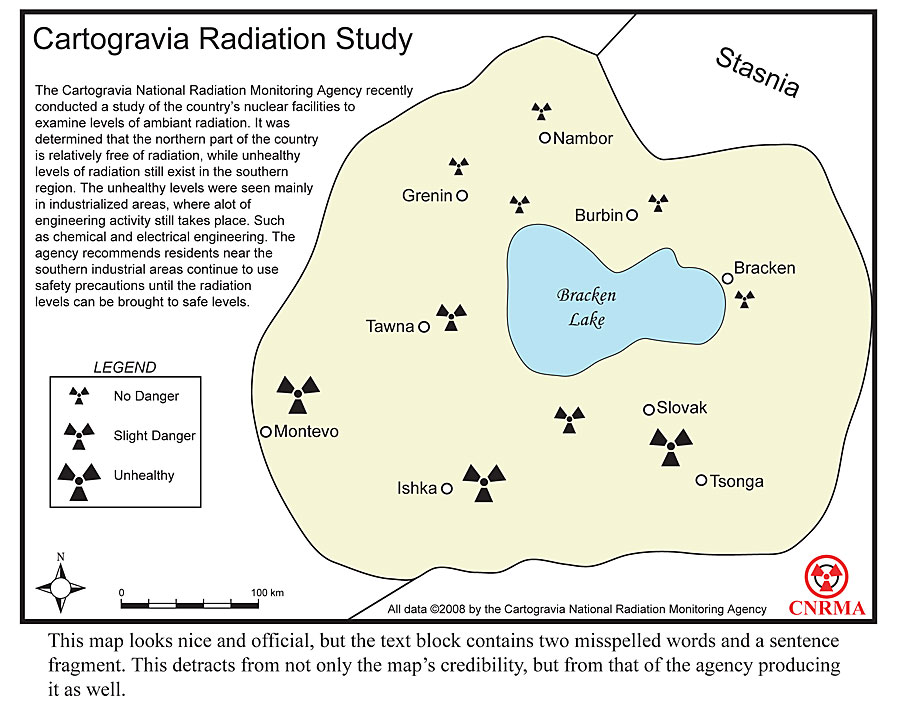
Yet maps are now frequently generated by users with little or no cartographic background using desktop and Web-based GIS applications, and often these maps don't receive any type of peer review before being presented to an audience. A fundamental and important aspect of many maps is the use of explanatory elements, such as data tables and text blocks, which, of course, entail using language—text, writing, spelling, grammar—yet, historically, these language decisions have pretty much been left to the discretion of the mapmaker. Because it is important for the mapmaker to present any descriptive or explanatory information succinctly and correctly, this article will focus on the importance of these specific elements. While there is certainly nothing "wrong" with adding descriptive or explanatory elements to a map, for example, tables and text blocks, care should be taken to ensure it is done with the same diligence used to create the map itself. Use descriptive text elements wisely; before adding them, determine if they are absolutely necessary to convey the map's message. Sometimes, such as on a map with a simple dataset, a well-designed legend will preclude the need for descriptive text altogether. But, at other times, some additional text may indeed be necessary, perhaps to help explain the use of multivariate symbols or a more complex dataset. If it is determined that such a text element is necessary, it should be placed on the map so as to not obscure or visually detract from the principal data being presented. Don't add a text block solely to take up empty space or to visually try to "balance" a map; it will most likely make the map look amateurish and hastily put together and will detract from its credibility. Also, if the data or ideas presented in the descriptive element were acquired from an outside source, there should be proper acknowledgment, just as if the reference were in any other work of literature or research. Just as with any other form of communication, the intended audience must be kept in mind during the mapmaking process, and descriptive text must be easily comprehended by that audience. Grammar 101
As many GIS applications today allow descriptive or explanatory text to be easily inserted into a map, today's mapmakers must also be mindful of the form of such elements. With no real convention in place for the format of these elements, mapmakers must ensure that proper grammatical rules are adhered to. As the map is indeed considered a medium of communication, any text on it should be subject to the same scrutiny as any other form of written communication with respect to proper form, spelling, and grammar. Unfortunately, I've seen numerous examples of both mapmakers and map editors treating a map as if it were just a graphic in some larger composition. A case in point: At a recent conference, I saw a map that had been produced by a national agency. The map attempted to compare the use of various 3D mapping techniques and was accompanied by a large descriptive text block extolling the advantages and disadvantages of each example. However, the text was poorly composed with sentence fragments and incorrect spacing throughout, and nowhere in it were the various techniques and terms it was describing ever actually defined. This map failed as a communication device, for had I not known what the techniques were before viewing it, I certainly wouldn't have known afterward. In other words, the text on a map should not be exempt from the same professional review that the rest of the piece receives. A map is just as valid as any other essay or written work and can contain the same errors. Therefore, it should receive the same scrutiny before being released for viewing. For this reason, the mapmaker (or whoever is ultimately responsible for releasing the map) needs to be as well-versed in grammar and spelling as in cartographic design. It could also be useful to use word processing software or text editing software to first draft the text, do a spelling and grammar check, then copy and paste the text into the map. Good News and Bad News
The good news in the cartographic community today is that anyone with a computer can make a map. The bad news in the cartographic community today is that anyone with a computer can make a map. The proliferation of desktop and Internet-based mapping/GIS applications has given practically anybody with computer access the ability to make a map now. I have seen large agencies install desktop GIS applications on multiple workstations, where many users have no experience or training at all in map creation. While some of these installations are intended only for users who need a topological tool, some are intended for actual map production. The latter case is where the proper writing and other cartographic issues come in. In fact, many of these users may not be familiar with even the use of the application. And many of these maps are created independent of any cartographic community, where peer review and input could be extremely valuable in making the map a much more effective exhibit or communication tool, with respect to the proper form and use of any descriptive elements or terminology therein. At the least, a representative from the intended audience can be asked for input on the design of the map as that will also provide some feedback about its effectiveness. ConclusionFor the map, then, to be an effective communication tool, it must be well designed with its audience in mind, and it must be clear and concise. But, as there is no real convention for descriptive elements, it becomes up to the mapmaker to effectively create and place any such elements within the design conventions that work best for each individual map. With increased access to digital mapping applications, if there is to be written copy on the page along with the map, mapmakers now should be as fluent in writing as they are in cartographic design and be able to use word processing software effectively. And if we are to truly embrace the map as a communication tool, such awareness of the importance of descriptive elements needs to be taught within actual geography curricula, both within standard cartographic programs and within the many GIS certificate courses now being offered alongside them. As GIS courses become more integrated into geography curricula everywhere, we run the risk of losing the art of creating a map that is an effective communication tool in favor of merely teaching the student how to use the GIS software. A concerted industry-wide effort must be made to educate today's new mapmakers, not only on the basic accepted principles of cartographic design but also on effective presentation, including the effective use of descriptive and explanatory map elements. ResourceClarke, J. I. "Statistical Map Reading." Geography, 44: 96�104. About the AuthorChristopher Sellers is currently a member of the Information Technology section of a Los Angeles, California, area government agency, where he is responsible for the majority of the agency's GIS and graphics production. More InformationFor additional information, contact Christopher Sellers (e-mail: mercator@dslextreme.com). |