|
CAD Data in Three Dimensions
By Mike Price, Esri
|
|
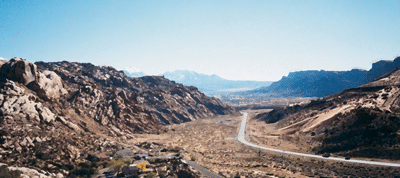
Photo courtesy of Tresa McDonald
The second in a series on modeling CAD data describing the City of Moab.
| |
|
Editor's note: This article builds on the CAD processing skills learned in "Modeling CAD Data in ArcView GIS" which appeared in the October-December 2000 issue of ArcUser magazine. That article, also available from the ArcUser Online Web site, showed how to load, filter, and display Computer-Aided Design (CAD) data for Moab, Utah, in ArcView GIS. Using a world file, this data, originally created in a local coordinate system, was registered into Universal Transverse Mercator (UTM) and displayed with digital elevation model (DEM) data. This article will show how to use contour lines and spot elevation extracted from CAD layers to generate triangulated irregular network (TIN) themes. Line and point data for roads and utilities will also be extracted. All these themes will be moved into ArcView 3D Analyst to be displayed in three dimensions.
Transportation specialists, civil engineers, emergency managers, public planners, and others use CAD to design, build, and monitor construction activities. CAD allows engineers to create, edit, and present vector information in local or global coordinate space. Using the CAD Reader extension that ships with ArcView GIS, CAD data can be added to a project. This imported data can be registered into the same coordinate systems as other data by using a world file. Themes can be suspended on, above, or below a digital terrain model to show relationships between data sets.
About the Model
This article will use CAD data from the City of Moab to model terrain, roads, and above-ground and buried utilities. Displaying this data in a three-dimensional model shows the relationships between several utility sets, including water, sewer, gas lines, fire hydrants, poles, and light poles, in an older part of town affectionately called Steenville after Charlie Steen, Moab's "Uranium King." The data used for this exercise is actual infrastructure data from Moab, Utah, used here by permission. Planners and emergency managers use this data to plan and mitigate natural hazards including floods and wildland fires.
What You'll Need
- ArcView GIS 3.2
- ArcView 3D Analyst
- Pentium II computer
- 100 MB of free disk space
- Sample data set
|
If you completed the model described in "Modeling CAD Data in ArcView GIS" in the October–December 2000 issue of ArcUser magazine, you will use the same directory structure (shown in Figure 1) and the CAD filtering and registering techniques learned previously for this project. Download the self-extracting zipped file from the ArcUser Online Web site. Place the moabtopo.dwg, moabutil.dwg, and wldfile1.wld files in Moab_CAD\DWGFiles\Local. Store the moabroad and clippol1 shapefile sets in Moab_CAD\SHPFiles\UTM27z12. A printer friendly version of this article is available.
If this is your first try at CAD modeling, read this article first to learn about the basics of CAD data importing and development.
Loading CAD Topographic Data
Before CAD data can be used by ArcView GIS, the CAD Reader extension must be loaded. CAD data files will not be visible unless this extension is loaded. With the 3D Analyst extension, CAD data can be used to create a TIN of the Moab data in UTM space by loading contour lines, spot elevation points, and a clipping polygon into a view. This model shows how Steenville was platted and built back in the late 1950s. Roads and utilities will be displayed into two-dimensional and three-dimensional views.
- Start ArcView GIS, open a new project, and create a new View. Choose View > Properties to name the new view UTM NAD27 Zone 12. Still in the View Properties dialog box, set both the map units and distance units to meters.
- Load the CAD Reader and 3D Analyst extensions by choosing File > Extensions from the menu and checking the boxes next to CAD Reader and 3D Analyst. Set the working directory by choosing File > Set Working Directory and entering [drive letter]:\Moab_CAD.
- Save the project with the name Moabcad2.
- Click on the Add Theme button and navigate to the Moab_CAD\DWGFiles\Local subdirectory to load moabtopo.dwg. If this file is not visible, verify that the CAD Reader extension is loaded. While still in the Add Theme dialog box, click on the yellow file folder icon to expand moabtopo.dwg and view the line, point, polygon, and annotation data layers. Click on the line data file, hold down the shift button, and click on the point data file to add both these layers as themes.
- Make the line theme active and choose Theme > Properties and then the Definition feature. Change the name of the line theme to Contour Lines. Make the point theme active and change its name to Spot Elevations.
- Still in the Theme Properties dialog with the Spot Elevations theme active, choose the Drawing feature and select only the spot-elev layer from the layers list and click OK. Make the Contour Lines theme active, choose Theme > Properties then the Drawing feature and select the ind-cont-dep, ind-contour, int-cont-dep, and int-contour layers from the layers list.
- CAD data layers use pen color as the default classification field. Double-click on each theme to invoke the Legend Editor. Use it to reclassify both the Contour Lines and Spot Elevation themes using seven classes. Use Graduated Color as the legend type, elevation as the Classification field, and Terrain Elevation #1 as the color ramp.
- Navigate to the SHPFiles/UTM27z12 subdirectory and add the Clippol1 shapefile as a theme. Drag it to the bottom of the Legend. Double-click on this theme and use the Legend Editor to change the fill color to transparent and the line width to 2. Add the moabroad shapefile, also located in the SHPFiles/UTM27z12 subdirectory. Keep this theme at the top of the legend.
- If you click on either theme to make it visible, you will not see it. This is because the CAD data and shapefile data are in different coordinate systems. The next step is to fix that problem.
Registering CAD Data in Project Coordinate Space
Early surveying in the Moab Valley was tied to a local coordinate system registered in feet while much recent data in the area was created in metric coordinates projected in UTM NAD27 Zone 12. Applying a CAD world file will move the CAD data into UTM space. A fuller description of CAD world files appeared in the previous article, which ran in the October-December 2000 issue of ArcUser magazine.
- In the legend, make the Contour Lines theme active. Choose Theme > Properties and select the Drawing feature. In the Transform section, click the radio button next to World File and use the Browse button to navigate to the Moab_CAD/DWGFiles/Local subdirectory. Select the Wldfile1.wld file and apply it by clicking OK. Save the project.
- Now make the Spot Elevations theme active in the legend. Choose Theme > Properties and select the Drawing feature. In the Transform section of the dialog box, click the radio button next to World File and use the Browse button to navigate to the Moab_CAD/DWGFiles/Local subdirectory. Select the Wldfile1.wld file and apply it by clicking OK. Save the project again.
- Click the Zoom to Active Theme(s) button in the toolbar. The view will jump to the location of the reregistered CAD data. Inspect the view to verify that the CAD-based themes have been successfully transformed and are visible. The Contour Lines and Spot Elevations themes should now lie completely within the Clippol1 polygon.
| |
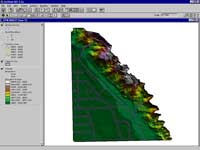
After creating the TIN, drag the Road theme to the top of the legend and display it.
|
|
|
Creating a TIN from CAD Data
The contour data and spot elevations contained in the moabtopo drawing file provide an excellent base to build a detailed three-dimensional terrain model of the northeastern portion of town. A TIN is composed of triangle nodes, lines, and faces and can be created from contour lines by breaking the line segments into individual nodes and applying a triangulation algorithm. 3D Analyst can create TINs from any combination of point, line, and polygon features as well as from grid data if these data sets contain some z values.
- In the legend, make the Contour Lines, Spot Elevations, and Clippol1 themes active.
- From the menu, select Surface > Create TIN from Features. In the Create New TIN dialog box, highlight Contour Lines. For Select Height source, choose Elevation and for Input as, choose Mass Points. Highlight the Spot Elevation and Clippol1 themes and set the Height source and input options as shown in Figure 2. Click OK when finished setting parameters for all three themes.
- When prompted, navigate to Moab_CAD/TINFiles/UTM27z12 and name the new TIN theme topotin. Once 3D Analyst has processed these themes, the new TIN theme, topotin, will appear in the legend. Turn off the Contour Lines and Spot Elevations themes. Click on topotin theme to make it visible. Depending on speed of the computer used, this theme may take a while to display. Drag the TIN theme to the bottom of the legend. Drag moabroad to the top and make it visible. Save the project.
Figure 2: Properties for Creating New TIN Dialog Box
| Theme | Class | Select Height
Source | Input As | Value Field |
| Spot Elevation | PointZ | Elevation | Mass Points | None |
| Contour Lines | PolyLineZ | Elevation | Mass Points | None |
| Clippol1 | PolyLineZ | None | Hard Clip Polygons | None |
Adding Utility Data in Two Dimensions
The City of Moab provides water and sewer service to the residents of Steenville. Local gas and electric companies also provide facilities mapping to Moab planners and engineers. Some of this data is included in the CAD file moabutil.dwg. This additional data will be added to the model and registered in UTM space.
- Click on the Add Theme button and navigate to Moab_CAD\DWGFiles\Local and select the point and line layers from moabutil.dwg in the same fashion as you added the point and line layers from moabtopo.dwg.
- Make the moabutil.dwg point layer active and choose Theme > Properties. Use the Drawing feature to select the elec-light-pole and elec-pole layers. Choose Theme > Properties and use the Definition feature to name the filtered theme Electric Poles.
- With the Electric Poles theme still active, choose Edit >> Copy Themes then Edit > Paste to make a second copy of this point set. Make the copied theme active and choose Theme >> Properties and select the Drawing feature. This time, select the water-hyd layer. Choose Theme > Properties and the Definition feature to name this theme Water Hydrants.
- Make line theme active. Choose Theme > Properties and use the Drawing feature to select the gas-line, water-line, and sewer-line layers. Choose Theme > Properties and the Definition feature to name this theme Utility Lines.
- Since these CAD files are also in a local coordinate system, select each theme and choose Theme > Properties and the Drawing feature to assign new coordinates using the same world file used for Contour Lines and Spot Elevations themes as described previously in the section "Registering CAD Data in Project Coordinate Space." After registering each theme turn all the themes on to verify that all the utility data resides on top of the contour lines and the TIN. Save the project.
- Double-click on the Hydrants theme. In the Legend Editor change the Legend Type to Unique Value and the Classification Field to Layer. Double-click on the Electric Poles and Utility Lines themes and make the same changes to the legends for these themes.
Displaying Utility Data in Three Dimensions
The next step is to display the TIN and vector data in a three-dimensional view.
- From the main project window, click on the 3D Scene icon to open a new 3D view. Choose 3D Scene > Properties. In the 3D Scene Properties dialog box name the new view Moab 3D Scene and change the background color to sky blue.
- Click on the View icon and make the UTM NAD27 Zone 12 view active. Turn off all themes in the legend. Make the Water Hydrants theme active and choose Edit > Copy to place it on the theme clipboard. Return to Moab 3D Scene and use Edit > Paste to add the Water Hydrants theme from the clipboard. One at a time, copy and paste the Utility Lines, Electric Poles, and TIN themes into Moab 3D Scene.
- Though these CAD themes were registered in two-dimensions, they are now in three dimensions. However, when these themes are displayed there is a problem. Turn on just the TIN theme and click on the Zoom to Active Themes button. Click on the Navigator button in the 3D Scene Viewer, place the cursor over the visible portion of the TIN and hold down the right and left mouse buttons or the center button (for a three-button mouse) and drag the TIN to the center of the 3D Scene Viewer. During navigation, data sets that are too large to be redrawn quickly are temporarily replaced by white boxes. Be patient and allow computer time to redraw the scene.
- The cliffs in the east look awfully steep! Because the vertical units from the CAD layers were not changed when these themes were reregistered, they are still expressed in feet though the horizontal units are now in meters. This causes a vertical exaggeration of approximately three to one. Vertical exaggeration defines the relationship of the x,y values to the z values displayed in a 3D Scene. The distortion affects all the themes in this view so choose 3D Scene > Properties and type in .3 for the Vertical Exaggeration Factor to change it for the entire view. Note that this change affects only the display on screen and does not affect analysis.
- In addition to changing the vertical exaggeration for the view, 3D properties such as extrusion values and offset heights can be set for individual themes. Manipulating these properties can allow data to be more clearly displayed.
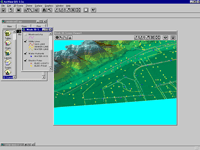
| |
Use the extrude and offset properties to make these themes more visible.
|
|
|
The Water Hydrants and Electric Pole themes will be extruded by adding a constant value to all the z values (i.e., adding to the base height). Offsetting the road and Utility Line themes will display them above or below the surface of the TIN. Make the Utility Lines, Electric Poles, Water Hydrants, and road themes active and select Theme > 3D Properties to invoke the 3D Theme Properties dialog box. In the section "Assign base height by:" choose Surface and path to the location of the TIN. Use the parameters in Figure 3 to set the values for each of these themes in the 3D Theme Properties dialog box.
- Turn on all the themes. The Electric Poles, Water Hydrant, and road themes will appear above the surface of the TIN. Because the offset height for the Utility Lines theme was set to -2, this theme is displayed below the TIN. To see this theme, make the TIN partially transparent by choosing Theme > 3D Properties and clicking on the Advanced button to set the transparency to a value between 20 percent and 50 percent. Save the project.
Figure 3: 3D Theme Properties for CAD-based Themes
| Theme | Offset Heights
By Value | Extrude Features
by Value
of Expression | Extrude By |
| Water Hydrant | 3 | 0 | Adding to base height |
| Electric Poles | 0 | 15 | Adding to base height |
| Utility Lines | -2 | 0 | None |
| Roads | 1 | 0 | None |
Summary
This truly three-dimensional model of the northeastern corner of Moab, Utah, uses the same data Moab's city engineers use to study relationships between water lines, sewers, gas feeds, and fire hydrants. If you are curious, you can add additional two-dimensional data by filtering the sidewalk and paved and unpaved road layers from the moabtopo.dwg file, registering them in UTM space, and adding them as themes to both the two-dimensional view and the 3D Scene.
Resources
Visit "Terrain Modeling with ArcView GIS" at the ArcUser Online Web site to download and work lessons based on earlier articles describing how to use data available from the USGS EROS Web site. Previous articles in ArcUser magazine have shown how to use Spatial Data Transfer Standard (SDTS) DEM data, digital line graph in optional format (DLG-O) vector data, Global 30-Arc-Second (GTOPO30) DEM data, digital orthophoto quadrangle (DOQ) image data, and Geographic Names Information System (GNIS) label point data with ArcView GIS, ArcView Spatial Analyst, and ArcView 3D Analyst.
|