ArcUser Online
Spring 2011 Edition
Shareable and Usable Geographic Knowledge
This article as a PDF.
GIS systems are emerging that connect all types of devices to a virtual warehouse of geographic information. Instead of using GIS just on the desktop or a mobile device, these systems encompass not only data but services, maps, apps, analytic models, data models, and workflows that make information accessible and actionable. In this emerging ecosystem of knowledge based on geographic information, using ArcGIS doesn't mean just using GIS software. ArcGIS is the key to vast resources for collaborating on, interacting with, analyzing, and sharing information.
This approach employs multiple maps generated from transactionally maintained databases that can help formulate answers to some of the seemingly intractable questions facing the world and foster new perspectives.
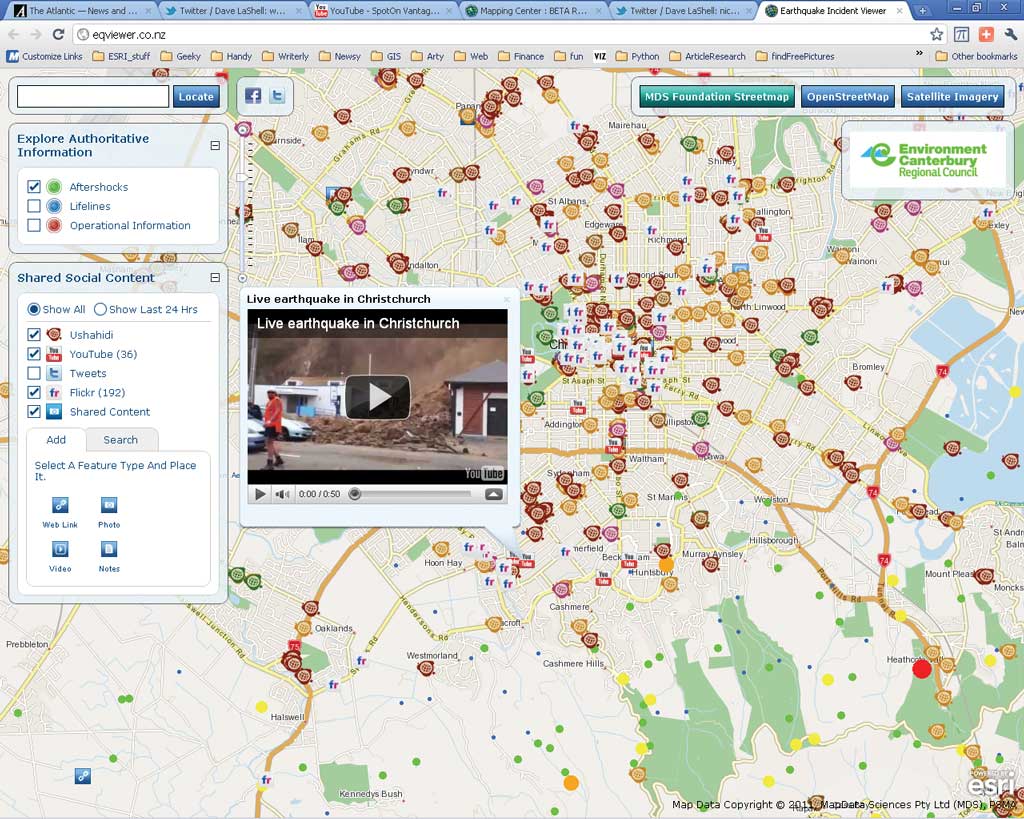
Volunteered geographic information (VGI) applications have harnessed social media feeds to aid response to events such as the earthquake in Christchurch, New Zealand.
Rather than being a departure from traditional GIS, this approach to the use of geographic information represents part of a logical progression from the desktop to the network that has now pushed out beyond the boundaries of individual agencies or companies. It expands the role of the GIS professional who not only continues creating and maintaining geospatial data and authoring maps but now also creates services and focused apps that make geographic knowledge that is shareable and usable.
The enhanced ability to use data sources has been vitally important to this transformation. Initially, scanned maps and aerial photography were the primary geospatial data sources. Now data sources have expanded to include satellite imagery; lidar returns; CAD data; and real-time measurements of traffic, earthquakes, stream flows, and many other phenomena by networks of sensors capturing them as well as media such as photos and video.
The popularity and growth of ArcGIS Online demonstrates how rapidly this new ecosystem of geographic knowledge is evolving. In just a few years, it has grown to become a repository for more than 45,000 maps, apps, and other resources and has 35,000 registered users. These users can access content derived from commercial and other authoritative sources, such as web maps, map services, apps, and layer/map packages, using ArcGIS or a web browser.
Content is constantly added. Beginning in 2011, ArcGIS Online basemaps (esri.com/mapservices) can be used without a subscription whether for commercial or noncommercial use inside or outside an organization. This policy change includes World Imagery Map, World Street Map, World Topographic Map, USA Topographic Maps, and DeLorme World Basemap. The only restriction is a high-volume transaction limit of 50,000,000 transactions in a 12-month period for nongovernment users. This volume is equivalent to 400,000,000 tile requests per year or more than 1,000,000 requests per day—a volume very few users will likely reach. This year, the site is also making the vast archive of Landsat imagery available as map services. (For more information, see "Over Time, Over the Globe: Landsat imagery archive made broadly available" in this issue.)
Not only have the volumes and types of spatially referenced data increased but also the ability of more people to interact and manipulate that data. Moving to pervasive platforms like mobile and web has had a tremendously transformative effect on GIS. It has meant more access by more people more of the time. It is more than just new data sources—there are new ways of interacting with geographic information.
The impact of volunteered geographic information (VGI) illustrates contributions that this geospatial ecosystem is making by enabling cooperation and better understanding of complex events. VGI applications have harnessed social media feeds, such as Twitter, YouTube, and Flickr, to respond to events that range from coordinating rescue efforts in emergencies such as the floods in Queensland, Australia, to understanding rapidly evolving situations such as the antigovernment protests in Tahrir Square that led to the revolution in Egypt.
At the same time, decision support apps that make information directly accessible by leaders are being created. Scheduled for release in April 2011, Community Analyst is an example of a web-based, GIS-enabled solution for nonexperts that provides decision support for leaders, government agencies, and organizations. Its online data and tools are simple, so users can easily explore and analyze data for any geography including census block groups and hand-drawn areas.
Through the map, thousands of demographic, health, economic, education, and business data variables can be accessed. Data can be mapped thematically and displayed with imagery. Any modifications to parameters are immediately shown. Tapestry Segmentation profile data can be included that reveals detailed lifestyle and consumer behavior for neighborhoods in an area of interest. Up to five customizable criteria can be searched at once with the Smart Map Search function.
This interactive environment lets decision makers model outcomes by identifying where allocated resources will have the greatest effect or which people will be affected by a specific decision. By examining patterns, relationships, and trends in a community, more appropriate strategies and policies can be developed.
Reports and maps customized to the community can more effectively communicate those strategies and policies. Community Analyst can generate print-ready reports, files in Microsoft Excel, and maps in PDF format.
In this new environment, a dialog between policy makers and citizens can be enjoined. Presenting information on national issues and trends in maps along with the tools to interact with that information supports informed participation in government.
Esri Redistricting, a new online platform, helps engage more US citizens in the process of redrawing the nation's political boundaries by removing the barriers of cost, data availability, and accessibility. For more information, see "Opening Up the Process: Web-based application encourages citizen involvement" in this issue.
Web mapping is becoming an increasingly common mechanism for government to communicate with its constituency. Recovery.com supplies current information on grants and contracts awarded by the US government through the American Recovery and Reinvestment Act of 2009 (ARRA). The ability of citizens to interrogate the map and obtain current information about specific projects promotes government transparency and accountability.
The new information ecosystem makes geographically referenced information more accessible by a greater variety of people who can share a common operating picture and work together more effectively. "GIS for everyone" was proposed by Esri president Jack Dangermond more than a decade ago. In this new ecosystem of knowledge, it is much nearer to reality.