More Techniques for Effective Mapping
by Jim Mossman, Data Deja View

| More Techniques for Effective Mapping by Jim Mossman, Data Deja View | |
|
Editor's note: "Relief Mapping--Real-World Challenges," in the last issue of ArcUser magazine, described the steps Jim Mossman used to create a beautifully shaded relief basemap of Wyoming using the ShadeMax color palettes he developed as well as other tools available from the ArcScripts pages of the Esri Web site. This article describes techniques that made a shaded relief map of Northfield, Vermont, more effective. 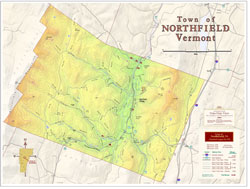
This map of a Vermont town was produced using ArcView GIS 3.2 and ArcView Spatial Analyst and XTools extensions available from the ArcScripts pages of the Esri Web site. Although data import, projection, and overlay tasks were performed using the ArcToolbox application in ArcInfo 8.0.2, those tasks could have been carried out using ArcView GIS. The large datasets used for this map seriously challenged the author's hardware--a Dell Precision 410 with dual 400 MHz processors, 512 MB of RAM, and a 32 MB Diamond Fire GL1 AGP video card. This computer was running Windows NT 4.0 with Service Pack 6a. Printing was done on an Epson Stylus 3000 at 720 dpi using Epson drivers and ArcPress for ArcInfo. The Town of Northfield, VermontVermont towns are rather small. Using shaded relief exclusively within the town's borders would omit key terrain features that might help in visualizing the town's relationship to its surroundings. On the other hand, since the focus of this map is the town, the use of colorful shaded relief across the entire map area would distract the viewer from the map's subject. Ideally, subdued shaded relief in the areas outside the town would show the surrounding terrain and more colorful shaded relief within the city limits to focus attention on the town. Dual Elevation EncodingThe strategic use of subdued and colorful relief mapping was achieved by using different color schemes within the same grid. The grid's elevations were modified so that separate elevation color sets could be applied to two areas of the map. This was accomplished by manipulating the elevation values selectively so that the focus area and surrounding area no longer shared common elevations.
More Design ConsiderationsThe light background of relief used for the area outside the town limits serves the same purpose as white space typically used in map composition. While this light background is not as effective as white space in calling attention to the main subject (the town), this compromise was necessary so that relief features outside the town could be included. The backgrounds of the legend and provenance insets were colored to harmonize with the surrounding map area so that they would not detract from the town itself. Because elevation values were important in this map, contour lines and spot elevations were included instead of an elevation legend. Contours were used only within the town boundaries, further drawing attention to the subject town. ConclusionUsing the subtle colors in the DDV's ShadeMax Color Set and assigning multiple properties to a grid through elevation modification gave this relief map new usefulness. For more information about creating these maps, contact the author at ddvgis@myavista.com. ResourcesThe Vermont Center for Geographic Information was the data source. Data Deja View's ShadeMax color set and the XTools extension are posted on the ArcScripts Web site. About the AuthorJim Mossman worked for many years in the Vermont State government assisting a number of departments in the use of data processing from the early days of punch card machines up through mainframes to CAD and GIS systems. He has created and shared an extensive collection of ArcView GIS and ArcInfo marker symbols as well as color sets through the Esri ArcScripts site. Some of the color palettes he developed ship with ArcView GIS 3.2. Two other articles about making better maps using ArcView GIS have appeared in the January–March 2001 and April–June 2001 issues of ArcUser magazine. |