October - December 2002
October - December 2002 |
||||||||
|
|
||||||||
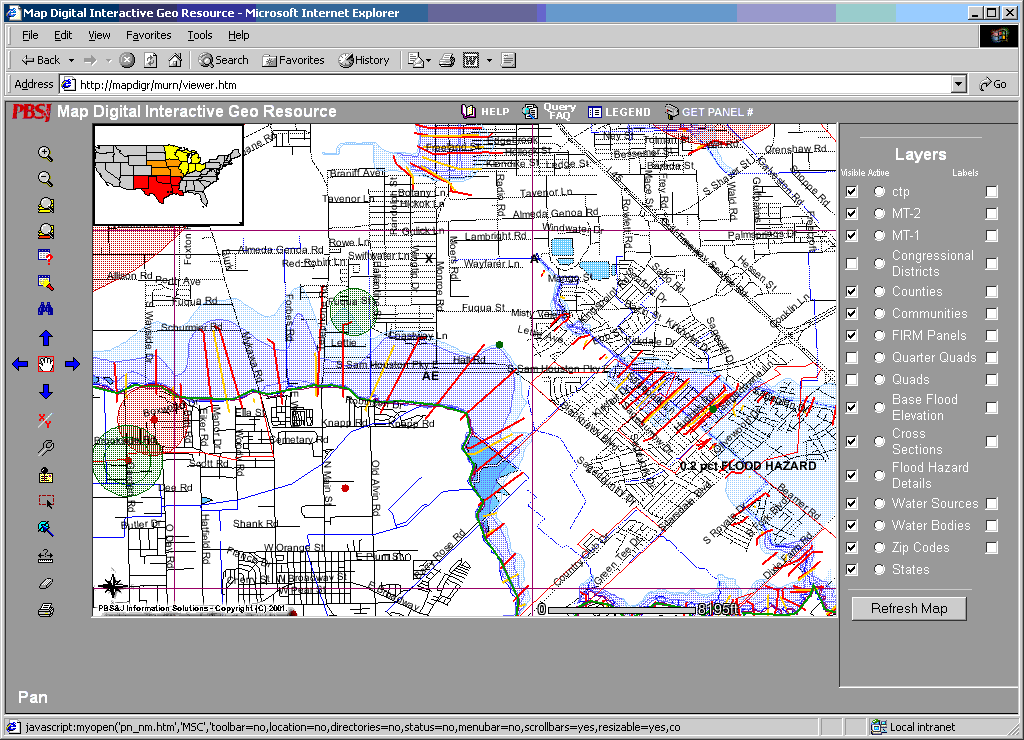
PBS&J, an Esri business partner, is currently FEMA's MCC for Regions V, VI, and VII which include Arkansas, Iowa, Illinois, Indiana, Louisiana, Kansas, Michigan, Minnesota, Missouri, Nebraska, New Mexico, Ohio, Oklahoma, Texas, and Wisconsin. Approximately 130 PBS&J staff members in the Beltsville, Maryland, office manage, develop, and expand FEMA's flood map data. In addition to developing procedures to create digital FIRM maps in a GIS environment for FEMA's Map Modernization Program, they are also tasked with responding to formal requests for letters of map revision (LOMR) and letters of map amendments (LOMA). [In 1997 FEMA began modernizing the FEMA flood mapping program. As part of the Map Modernization Program, FEMA is working to develop up-to-date flood hazard data for all flood-prone areas nationwide, provide the maps and data in digital format, and improve processes for creating and updating maps.] FEMA receives approximately 6,000 LOMA and LOMR requests annually in the Central Territories, the area handled by PBS&J, and is legally bound to answer within 60 days. To respond, caseworkers entered new case data into Microsoft Access or Oracle databases. The design of these databases coupled with the number of cases made locating information cumbersome. To assemble the required documents, such as old case history requests, flood insurance studies, and related flood hazard map panels, analysts had to locate copies of documents that were stored as paper or Mylar copies in massive libraries and make special requests to obtain these documents. To improve this process, PBS&J and FEMA decided to implement a comprehensive, accessible GIS that would not only allow analysts to more efficiently respond to the growing number of customer requests but also make flood data more accessible to those inside and outside FEMA. To put map and related data on a caseworker's desktop, PBS&J needed to spatially and digitally enable FEMA's massive paper filing library. A Web-enabled application, Map Action Processing Digital Interactive Geo Resource (MAP DIGR), is the foundation of this new system. The original concept behind MAP DIGR was to merge the more than 45,000 existing database records with existing flood mapping layers in a GIS environment. In doing this, spatial information, such as street address, related FIRM panels, or latitude/longitude coordinates, that were stored in the database record would be used to graphically show the location of a LOMR or LOMA. Associated information such as any existing digital flood layers, local roads, census data, and even hotlinks to existing case data in digital format would also be integrated into MAP DIGR. Linking these items gives analysts easy access to a wealth of information about each case. Being able to see the location of cases in relation to streams, roads, and congressional districts provides a more complete perspective and goes well beyond a traditional database entry. The volume of cases and number of analysts potentially using this system meant that it needed to be highly accessible and user friendly. Therefore, developers decided to build the application using ArcIMS technology so that it could be accessed through a standard Internet browser and would be available from a workstation or through a remote connection. Analysts could access GIS functionality without having to install GIS software. "Out-of-the-Box" Functionality and BeyondMAP DIGR uses basic GIS functionality that is part of the ArcIMS software to allow users to search through many data layers. Using basic GIS tools, users can easily change the active layer, zoom to active layers, and view the legend for the current map scale. The MAP DIGR makes use of the scale dependent display in ArcIMS. Users can also identify attribute information of individual features within the active layers using the identify tool. The available layers include LOMR and LOMA case data locations that are extracted from database records, United States Geographic Survey (USGS) quadrangle and quarter quadrangle map boundaries, and existing FIRM panel boundaries. Flood hazard data layers that include data converted from CAD files, political boundaries, Base Flood Elevations (BFEs), geocoded street data, highway data, and the locations of FEMA's Cooperating Technical Partners (CTPs) are also available. MAP DIGR developers enhanced common GIS tools, such as query and search, specifically for the unique requirements of flood mapping. MAP DIGR includes specialized query functions that are accessed through custom drop-down menus and allow users to search active layers for features using any attribute with standard Boolean operators. For example, analysts can query for any BFE that is greater than 1,200 feet or search for a location by community, ZIP Code, or FIRM panel.
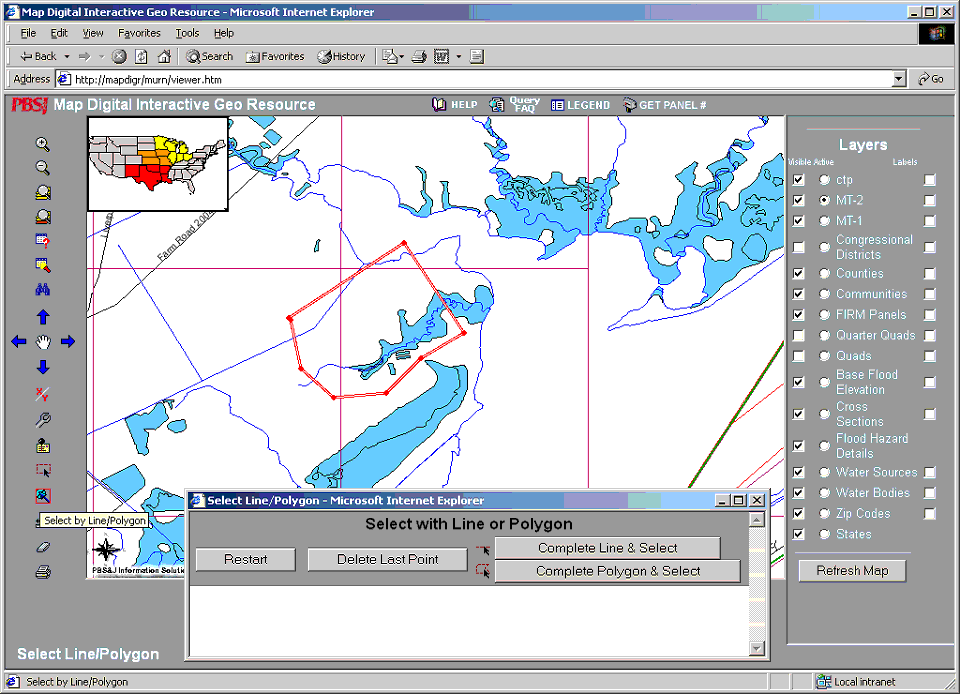
To save analysts time and energy, PBS&J also developed stored queries for the most common searches. These functions, accessible through drop-down menus, include searching for panels effective on a certain date or searching for all FIRM panels associated with a community and zooming to the selected features. An analyst can select records in the active layer, buffer those features at a user-defined distance, and determine features in other layers that lie within the buffer. For instance, an analyst can select and display all LOMA cases that are within 500 feet of the same flooding source and use this information to identify flood zones that may need to be restudied, or identify structures such as roads or communities that are within a certain distance of a flood source. Developers have also designed a buffering process using corporate boundaries and USGS quarter quads that recommends the approximate number of panels necessary to cover an area. This information can be used in deciding which areas need to be restudied as well as approximating the cost of a study. One additional search function developed within MAP DIGR is the Locate Address tool (i.e., geocoding tool). The Locate Address function searches existing state road information from Streets 2000, locates an address, and zooms to it making it easy to locate LOMA or LOMR cases or potential flood hazard areas near an address. Alternatively, an address can be buffered to determine where the closest interstate is, what ZIP Code it resides in, or what FIRM panels are within 2,000 feet of it. Continued on page 2 |