Realizing Spatial Intelligence on the GeoWeb
By Matt Artz, GIS and Science Marketing Manager
Using the City of Boston's Solar Boston interactive Web map, people can use tools to zoom in to neighborhoods and click on a building, such as their home or office, and calculate its solar energy potential if solar technology was added. The tool also calculates potential energy savings.
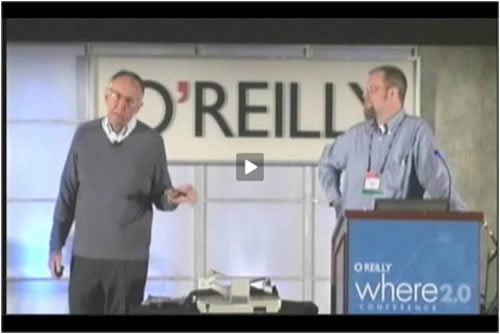
This is just one example of a Web mapping application that Esri president Jack Dangermond cited in his presentation Realizing Spatial Intelligence on the GeoWeb, which he gave in May 2009 at the Where 2.0 Conference in San Jose, California. Watch the video. One of the main themes of Dangermond's talk was that geographic knowledge created in GIS environments is increasingly being made available to Web 2.0 users.
Esri primarily focuses on GIS technology and GIScience, with an emphasis on supporting the company's software users. GIS technology users have made an enormous contribution of knowledge to the GeoWeb in terms of basemaps, thematic datasets, and other geographic information. "What drives GIS users is integration of geographic knowledge into human action," said Dangermond. "Using [geographic knowledge] can make a huge difference; it impacts business and government but also helps create a more sustainable world."
What Is Geographic Knowledge?
Dangermond said that geographic knowledge is much more than just data. He defines it in terms of six components:
- Data
- Data models that structure the data
- Models and analytic environments that show predictions or suitability (This is where different layers of information are combined and interpreted.)
- Cartographic expression-what Dangermond called "that thing that cartographers do, like color ramps [and] symbology sets"
- Geospatial workflows
- Metadata, which describes the five components above and is key to sharing, discovery, and access
Geographic knowledge is changing how we abstract our world. It is also changing how we reason, both in the professional world and in broader society, by introducing spatially integrated thinking.
"People are beginning to think about relationships-relationships between disease and environmental situations that may (contribute to) it," said Dangermond. "Or people are asking the question, 'If I locate this here, what are the consequences of it? The good work of Google and others in getting people spatially aware has consequences beyond simply looking at maps. It's causing them to do more spatially integrated thinking, and we're right in the midst of that today."
Shared geographic databases in concert with the Web 2.0 environment are also changing how we organize and communicate between different agencies and organizations. "I would assert that this is actually introducing a new approach for problem solving and thinking," said Dangermond, "and I would say it's just the beginning. It's going to go way beyond simple visualization and mapping. It's going to embrace all types of knowledge and ultimately become kind of a societal infrastructure for human behavior and human action."
Sharing Geographic Knowledge on the GeoWeb
At the heart of this evolving infrastructure are Web 2.0 GIS servers, or geoservers, that make geographic knowledge directly available for mashing up and integration.
"People author the knowledge, they drag and drop it onto a server, and then it's accessible on other desktops, in browsers, or on cell phones or virtually anything," said Dangermond. "The fundamental difference between this [Web 2.0] world and the worlds I've experienced in GIS before is that the Web is the platform. And it's transforming access to this geographic knowledge base, making it orders and orders of magnitude more available and usable and collaborative," said Dangermond. "So the GIS user community is basically supporting this notion of transforming datasets into services. Those published services can then be mashed up with other Web services in all sorts of forms and made available for new communities to leverage." At the Where 2.0 Conference, Dangermond and his Esri colleague Jeremy Bartley demonstrated several examples of sharing geographic knowledge on the GeoWeb, ending with the State of Maryland's StateStat Web application. The application lets the public see how much federal stimulus money is being spent, county by county, on highway improvement, education, health care, and transit, to name a few examples.
"This is a very powerful idea about having governments open up not just their GIS data, but all their data, using Web mapping as a framework to make government more transparent and more accessible-a new chapter of democracy opening up," said Dangermond.
He told the Where 2.0 audience that this was an opportunity for them to get engaged in building these kinds of Web sites to help open up government, to look at "the financial dimension of where we're making investments and where we need to make investments. When I show this to political people, they get very excited . . . because suddenly they can look at government transparency and accountability."
GIS servers are integrating geographic knowledge-data models, cartography, workflows, and metadata-with the GeoWeb. These servers are easy to use, standards-based, and collaborative, and will leverage the billions of dollars already invested by the GIS community in developing basemaps, thematic datasets, and other geographic information. Web GIS also promises to extend the vision of e-government. "Sometimes I like to call it g-government," said Dangermond, "because it's all about a geographic or map framework for making more transparent government policies. And this is a good and healthy thing."