
Elections
Modernize your elections operations with GIS
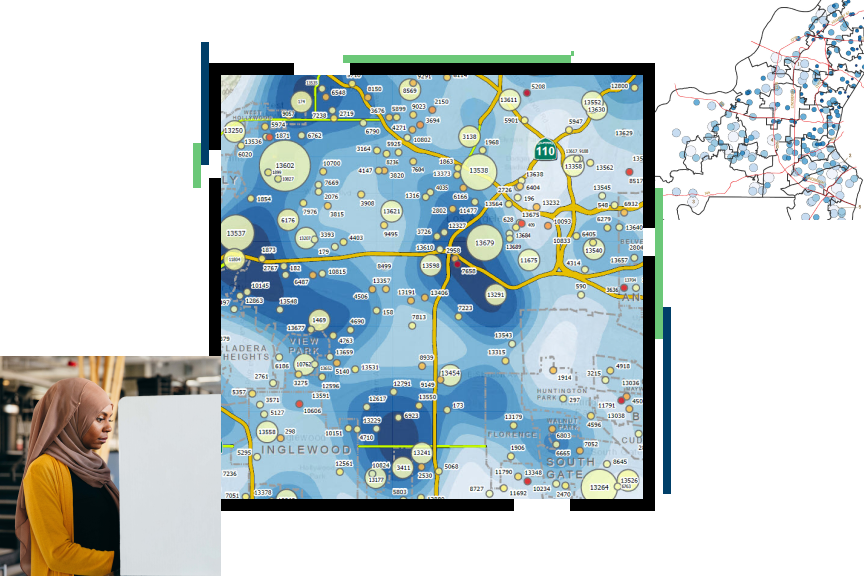
Election planning with GIS
Planning for today's elections requires that government adapts to changing technological advancements, voting preferences, and requirements. GIS helps government stay ahead of these factors. Shifting the focus to a location before, during, and after an election enhances the voter's experience with web-based maps and mobile apps helping voters participate in the electoral process.
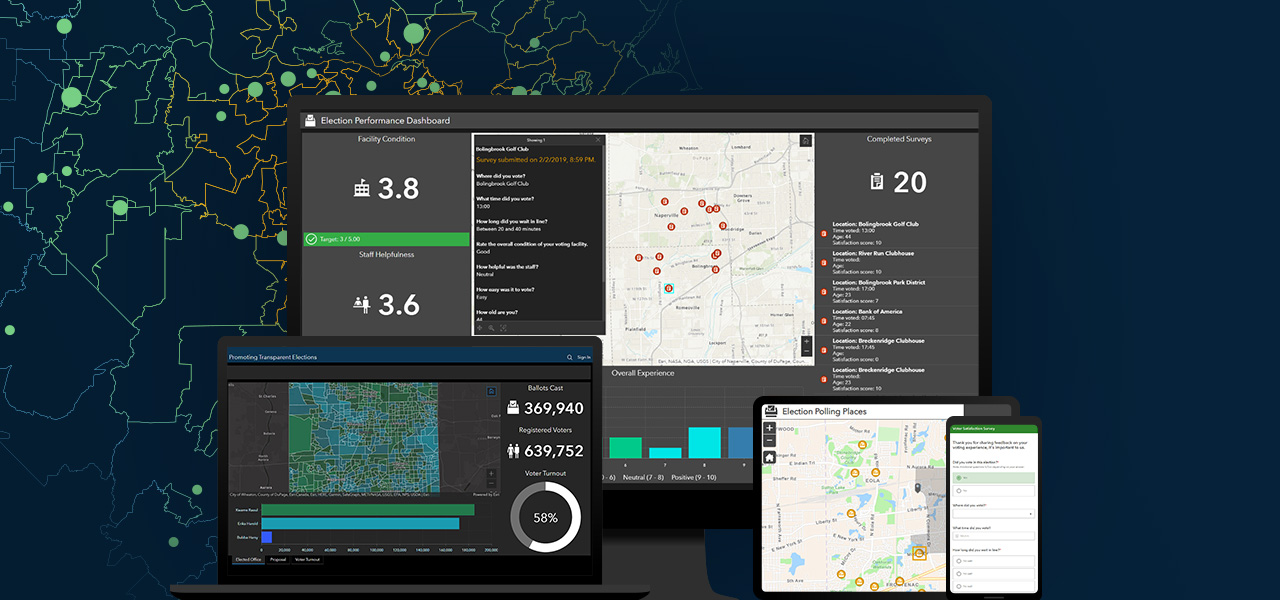
Modern elections departments embrace GIS technology to
- Streamline election preparations.
- Support Election Day activities.
- Increase voter outreach and education.
- Deliver user-friendly election results applications.
Elections workflows
Previous
Next
Upcoming event
Esri User Conference | July 13–17, 2026 | San Diego Convention Center | San Diego, California

Our community
Find out how your peers are using Esri technology to achieve their goals.
