Get deeper spatial context
Organize and enrich election results data for stakeholders to explore based on their location. Let the public see how local precincts voted on candidates and measures on an interactive map.


Geo-enable elections for accurate data and analysis
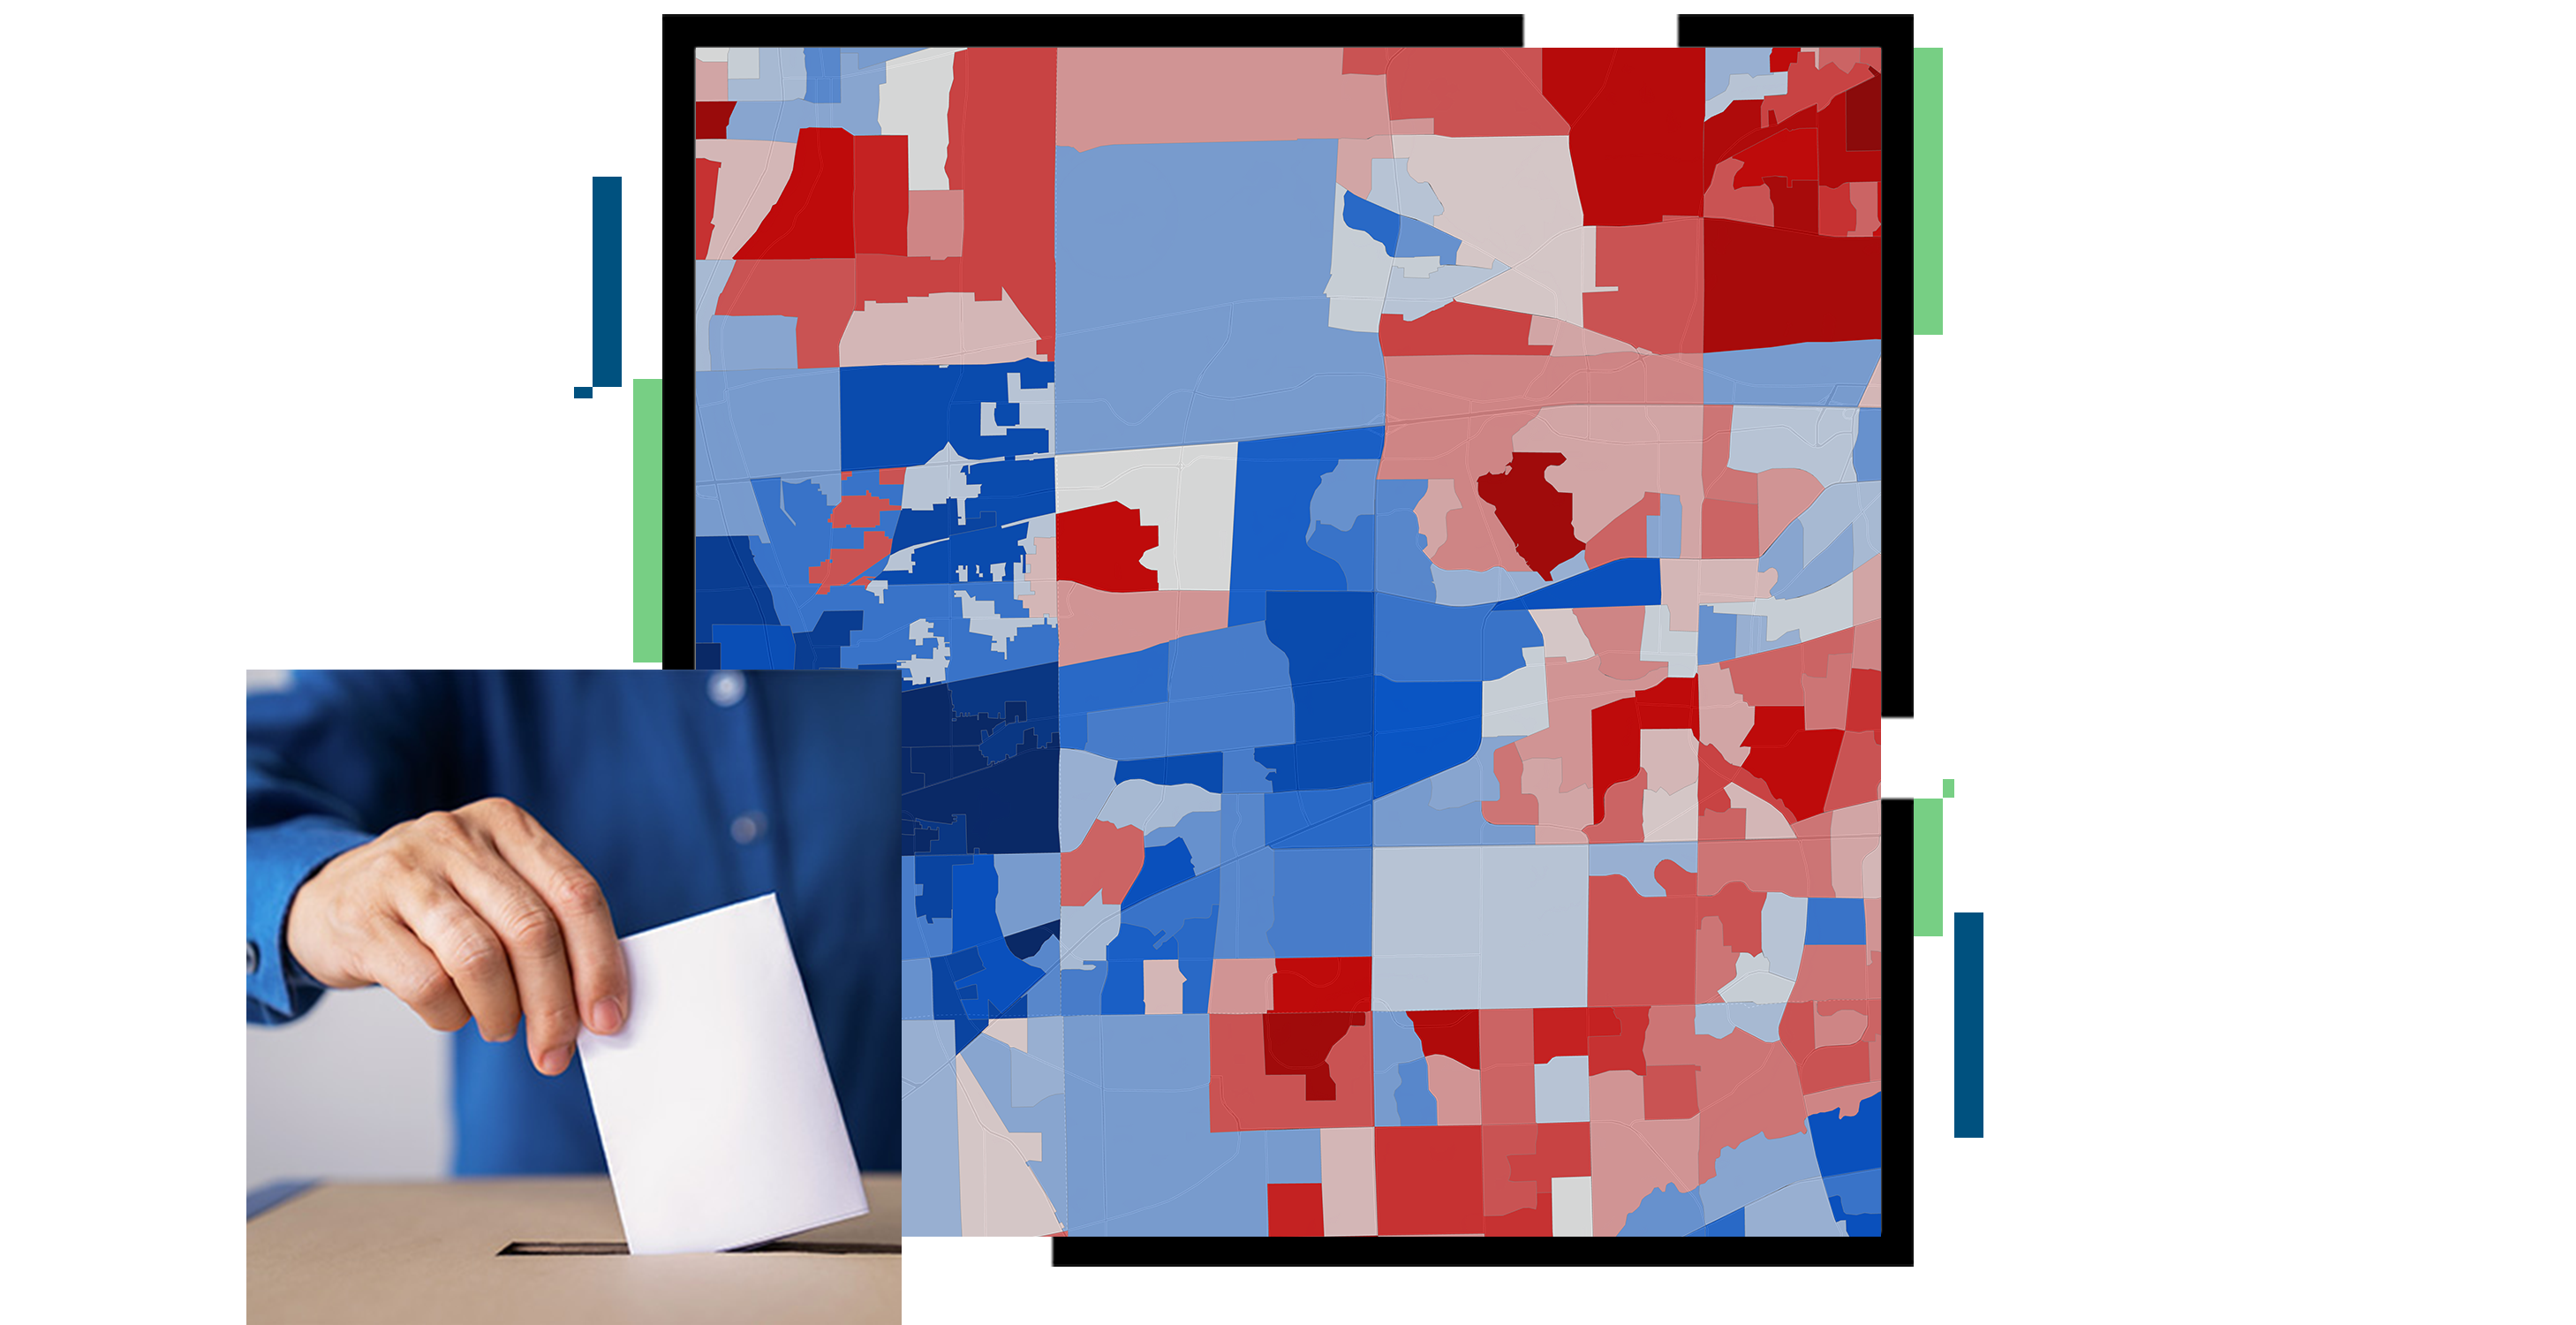

Organize and enrich election results data for stakeholders to explore based on their location. Let the public see how local precincts voted on candidates and measures on an interactive map.
Review election results data and turnout in real time instead of waiting until postelection to see which areas had lower or higher turnout rates. GIS helps you quickly identify voting patterns in your community and maintain that data as a record to compare year after year. Dive deeper and see how voting patterns change over time.
