Skip to Content

Outreach

Grow voter engagement with GIS

A concentration map with dark green and aqua points on a gray background, overlaid with a photo of a casually-dressed person leaning into a beige voting booth in a brightly lit room

Encourage voter participation in the election process by using GIS. Shifting the focus to geography fosters trust and enables a sense of collaboration among constituents. Help voters quickly find and get to early voting centers and polling places, see polling place wait times, and explore who the local candidates are. GIS helps answer the complex questions that depend on a voter's location during an election.

Capabilities of GIS for outreach

Answer questions and improve voter turnout

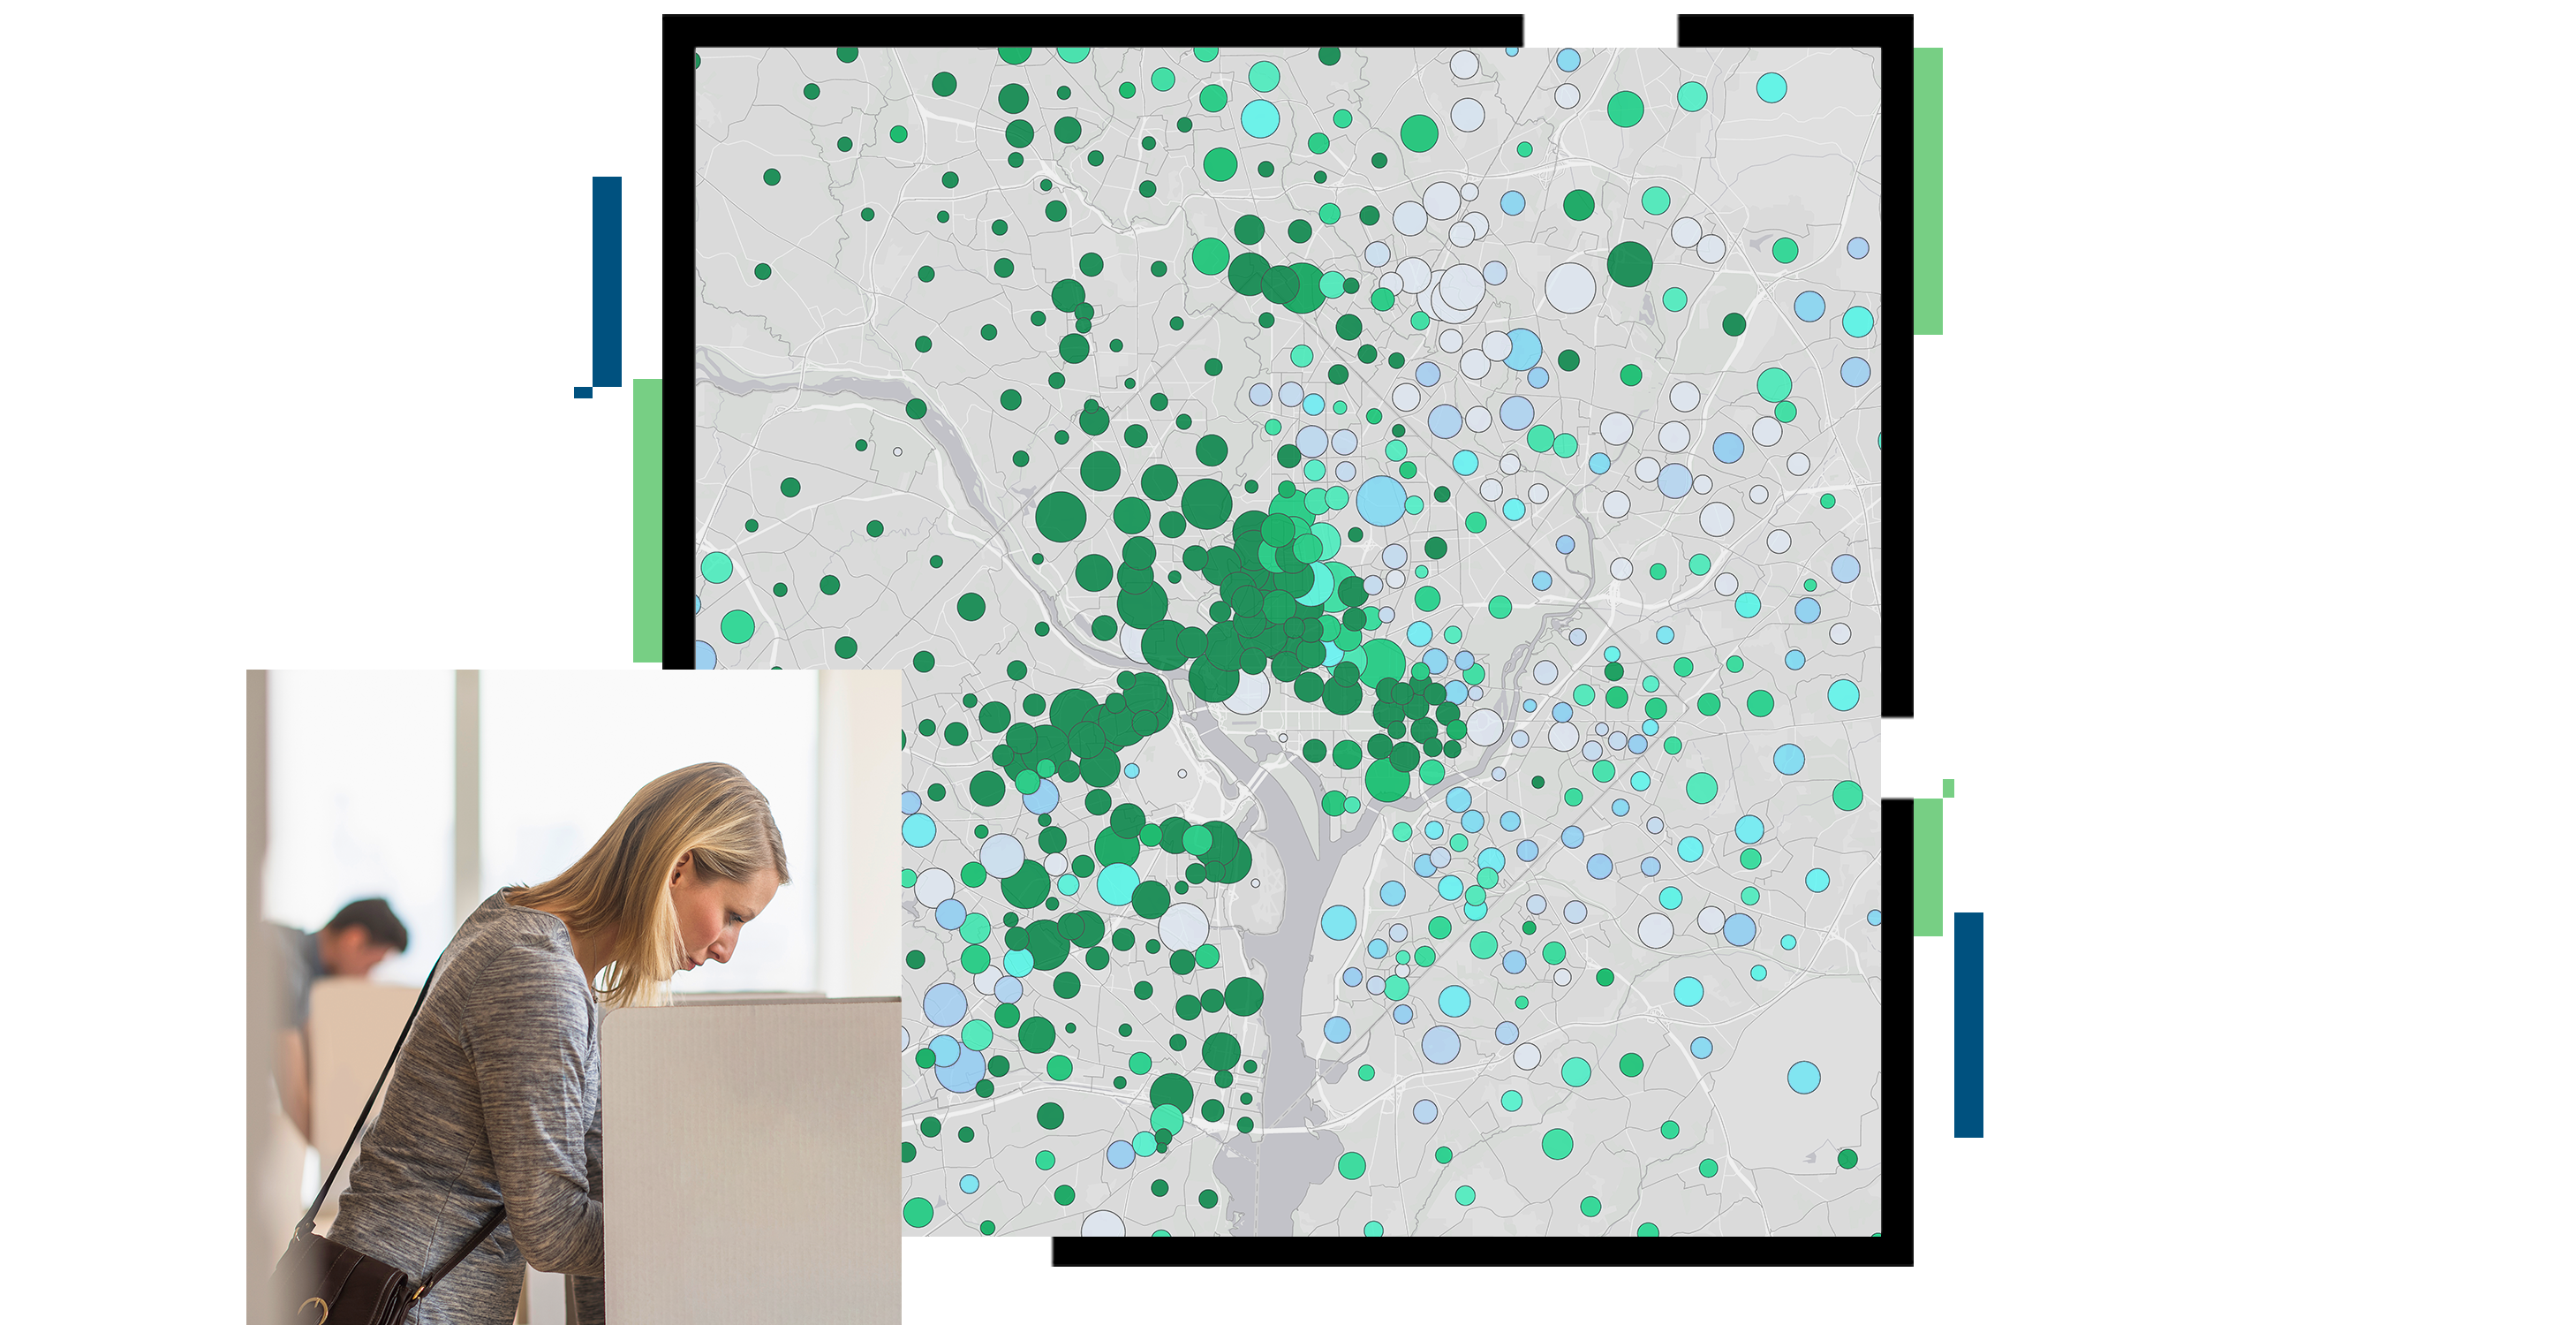
Simplify election information and provide answers that add context and understanding to improve election participation. Host web map applications that focus on a voter's location and provide answers to common questions like where to vote, who the candidates are in a voter's area, and how to fill out a ballot.

Graphic of a computer monitor displaying a city map in beige beside a legend of analysis options

Recruit election volunteers

Leverage the enthusiasm of volunteers through engagement features in GIS. With a form-based web application, modernize how you recruit poll workers and streamline how that information is organized in your internal processes. Make the recruitment process mobile-friendly and ensure that it's easy for anyone to volunteer when and where they are needed most.

A graphic of a computer monitor displaying a pop-up form for election day worker volunteer signup against a forest green background

Assist voters 24/7

Extend your office hours and services without additional resources. With no prior GIS skill, configure a single website that organizes information that the public can easily find. Organize voting location web maps and how-to videos and answer frequently asked questions. Modernize how government delivers election resources to voters to help cast their ballots.

A graphic of a computer monitor displaying a data hub with five choices of election maps against a dark blue background

Access neighborhood-level data

Get thousands of authoritative demographic datasets that you can plug into your existing work to better understand the households in an area of interest. With neighborhood-level insight, develop strategies to turn the less engaged patterns of the past toward greater participation in the future.

A graphic of three different maps layered together in shades of purple, pink, and indigo

VIDEO

Best practices in election administration

The director of elections for the Durham County Board of Elections discusses the use of GIS in recent elections.

Products for election outreach

Previous
Next

Elections workflows

Previous
Next

Contact sales

Contact us

Outside the United States

Connect with the Esri elections team