ArcUser Online
|
Unlock Worldwide Resources By David Davis and Keith Mann, Esri Virtual Campus |  |
|
Editor's Note: Data integration has long been recognized as one of the great strengths of GIS. Organizations worldwide have spent billions of dollars synthesizing and integrating spatial data for internal use. The Geography Network provides a portal that unlocks these vast resources by allowing simple, real-time, remote access to this data through the use of ArcGIS. This tutorial requires ArcInfo 8.1, ArcEditor 8.1, or ArcView 8.1 and an Internet connection. ArcIMS, one part of ArcGIS, provides an easy way to publish maps, geographic data, and spatial applications on the Internet. An article in the October–December 2000 issue of ArcUser magazine, "Creating a GIS-Enabled Web Site Using ArcIMS," walked readers through the simple three-step process of setting up an ArcIMS site and publishing a Map Service. ArcCatalog and ArcMap, two of the desktop applications in ArcGIS, can work with data from ArcIMS services in the same manner as data stored locally or on a local network. ArcCatalog explores and manages Internet data sources, and ArcMap displays and analyzes data. This article describes how to take advantage of connectivity with the Geography Network that is built into ArcCatalog and ArcMap. Although the Geography Network includes many types of content, this tutorial focuses on using ArcCatalog and ArcMap to access ArcIMS Map Services. 
What is a Map Service? A Map Service is a "live" map that is published over the Internet using ArcIMS. The map publisher defines the data that will be included and determines the map's geographic extent, symbology, and functionality. A Map Service can contain one or many data layers such as street networks or city points. There are two types of Map Services--Image Services and Feature Services. An Image Service is a snapshot of a map on a server that is delivered as an image and often used as a background for existing local data. A Feature Service provides more sophisticated functionality by streaming actual map features that are directly accessible by ArcMap. Characteristics such as drawing order can be changed. Data provided by a Feature Service can be used for analysis. Either type of Map Service can be accessed by ArcCatalog and ArcMap. Typically, both Image and Feature Services consist of one layer composed of many sublayers. Sublayers can be scale-dependent (i.e., these layers are only visible at a preset scale). Layers and sublayers can be turned on and off. When using image and Feature Services, it is a good idea to investigate the sublayers and turn off ones that visually conflict with other data in the data frame. Hide a sublayer by clicking on the dash in front of the layer name in the Table of Contents. A connection to the Geography Network server or other Internet map servers can be created in ArcCatalog to browse available data. Once an Internet server connection is added to ArcCatalog, all the Map Services available from that server are visible. This connection can be renamed with a more meaningful name, deleted, or disconnected. Simply drag and drop a Map Services icon from ArcCatalog to ArcMap to start that service in ArcMap or choose File > Add Data or click on the Add Data button to add Internet server connections. ArcMap has a built-in connection to the Geography Network. Choose File > Geography Network to access the Geography Network Explorer and browse available Map Services to locate data that can be added as layers. Adding Map Services Using ArcCatalog ArcCatalog must be connected to a map server before it can access Map Services. This next step will establish a connection to the United States Geological Survey (USGS) Internet server and access shaded relief raster data from the National Elevation Dataset (NED). This type of data is typically used for geographic reference or as a background for displaying other data.
Viewing Map Services in ArcMap One of the most powerful features of ArcMap is the ability to view more than one Map Service at a time, even if these services are located on different servers in different parts of the world. Both Image Services that were previewed in ArcCatalog in the previous steps will be added to ArcMap.
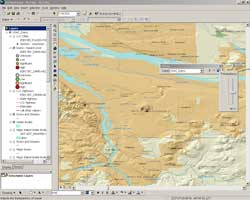
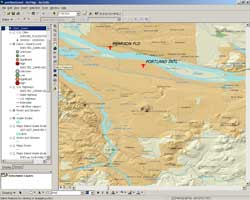
Inspecting the Layers With both Image Services in ArcMap, the next step is to zoom in on the Portland, Oregon, metropolitan area. Notice that not all the sublayers in both layers are turned on. Sublayers that have grayed-out check boxes in the Table of Contents are scale-dependent. Right-click on a layer with the grayed check box to bring up the context menu and choose Properties. Choose the General tab in the Properties dialog to see the minimum and maximum scale range for that layer. Choose the Sources tab to view information on the layer's coordinate system.
Adding and Modifying Data from a Feature Service Map Services can also be added directly to ArcMap from the Geography Network without connecting to an Internet server using ArcCatalog. A Feature Service will be added directly to ArcMap in this step.
This map can be saved so that when it is reopened ArcMap will automatically reconnect to the Map Services. Choose File > Save As and save the map document as portland.mxd to a local drive before closing ArcMap and ArcCatalog. Connecting to the Geography Network using ArcMap and ArcCatalog instantly expands your GIS and makes a growing library of data and services accessible from the desktop. To learn more about the Geography Network or to search for Map Services visit www.geographynetwork.com. In addition, Esri Instructor-led and Virtual Campus courses include instruction for integrating the Geography Network with GIS software. Learn more about Esri Training and Education. |