Mapping the Mars Rovers' Landing Sites
Continued...
Exercise Data
The two DEMs that include the Mars Rover landing sites cover 0� to 44� South latitude and 90� to 180� and 270� to 360� East longitude. Smaller cropped versions of the DEM tiles were generated and included the sample dataset, marsrovers_arcuser2004.zip (17 MB), that can be downloaded from ArcUser Online.
Optionally, you could work this exercise with the full DEM tiles. Each tile is 123 MB and can be downloaded from the Washington University MOLA site. Visit ArcUser Online for direct links to the full images.
Make sure you also download the label file that describes each image. ArcMap does not know how to read PDS images in this type of formatted image, which shares the same file extension (*.img) as an ERDAS IMAGINE format file. To solve this, a PERL script, called pds2world.pl, that can parse most PDS labels and write out a header such that ArcMap can read the image without conversion, was included with the sample data.
However, the header files for these images were included in the sample dataset in the mola_headers directory to eliminate the need to install PERL and the script. Make sure the header files are unzipped into the same directory as the downloaded images. For each *.img there should also be a *.raw and *.rww file. *.raw is an ERDAS raw header file and *.rww is the world file that positions the image. More adventuresome readers can download pds2world.pl from the webgis.wr.usgs.gov/perl.htm page at the United States Geological Survey (USGS) Planetary GIS site.
Adding the DEMs
Download and unzip the sample dataset in a folder on your hard drive.
- Start ArcMap and add the downloaded cropped DEM files spirit_mer_b_moladem.tif and opportunity_mer_b_moladem.tif (or *.raw files if working with the full tiles) to the data frame. To move from one image to the other, right-click the desired layer and choose Zoom to Layer from the context menu.
- Right-click on the name of each image and choose Properties. Click the Symbology tab and select Histogram Equalize to set a good color stretch, and choose the color ramp that ranges from white through pink to dark orange to match the illustrations or the white to dark red color ramp that also displays the DEMs nicely.
- If you have the ArcGIS Spatial Analyst or 3D Analyst extensions, create hillshades from these DEMs. For either extension, click on the extension toolbar menu's drop-down list, choose Surface Analysis > Hillshade, and use the default hillshading settings. If you lack these extensions, add in the two hillshade files, spirit_mer_b_hillshd.jpg and opportunity_mer_b_hillshd.jpg, that were included with the sample data.
- Drag the original DEMs above the hillshades in the Table of Contents and set their transparency level to 50 percent. Use a standard deviation stretch with a power of 2 on the hillshade to apply a contrast stretch on the image.
Adding MOC and THEMIS Imagery
All sample data images have been geometrically projected into an equidistant cylindrical projection. Some images will cover Spirit's landing site, and the others will cover Opportunity's landing site.
- Start building up the image layers by adding all the JPEG files from the themis_moc/directory.
- In ArcMap, right-click on the name of each image, choose Properties, click on the Symbology tab, and check the box next to Display Background Value and make sure the value is 0. JPEG compression causes a slight black fringe on the sides of the images. A value of 0 for the background value will cause these black edges on the images to display as no color.
- Arrange the images so the ones with the largest spatial extent are near the bottom Table of Contents.
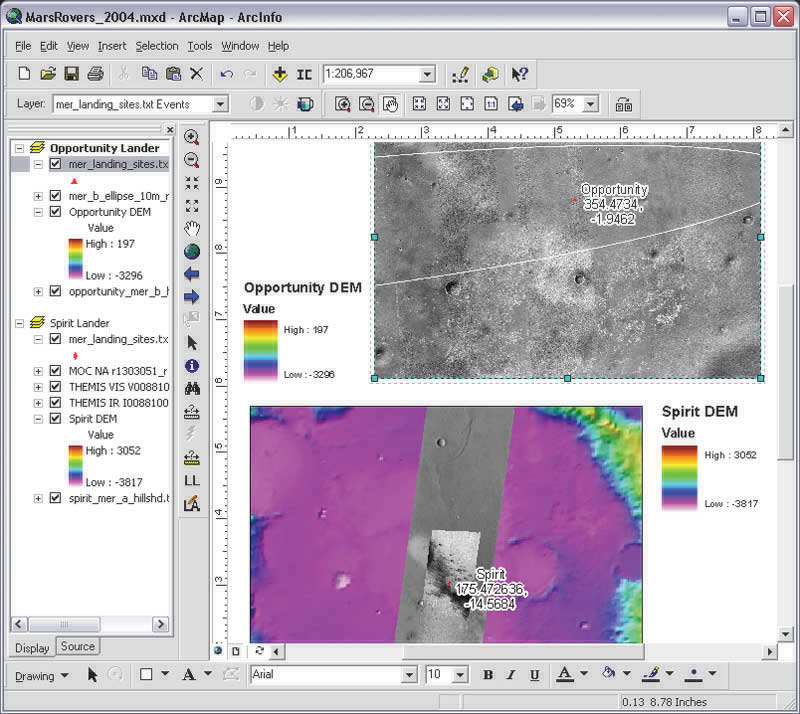
The Spirit landing site contains three types of images—THEMIS daytime infrared images, THEMIS visible images, and MOC images mosaicked together. The largest image, I00881002RDR.jpg, is a THEMIS daytime infrared image. This image is in the 9th infrared radiation (IR) band at 12.57 microns, has a spatial resolution of 99 meters per pixel, and is actually a measurement of temperature. The sunlit slopes are warm and bright, and the shadowed slopes are cold and dark. V00881003RDR.jpg, the next image, is a THEMIS visible image at 0.65 microns and a resolution of 17.4 meters/pixel. Both THEMIS images were made available courtesy of NASA, the Jet Propulsion Lab (JPL), and ASU. Spirit's last image, r1303051_r1301467_50_rectify.jpg, is two MOC images mosaicked together at a resolution of 1 meter per pixel and provided courtesy of NASA/JPL/MSSS. To fit the basemap, it was slightly rectified.
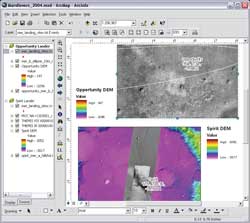 |
| An ArcMap layout showing the MOLA and image layers with the landing sites plotted as points |
The Opportunity landing site doesn't have as extensive a catalog of images although this will change as more images are gathered from the orbiting satellites. The main image for this site, mer_b_ellipse_10m_rectify.jpg, is a mosaic of THEMIS visible and MOC images and was resampled to a 10-meter/pixel resolution. The error ellipse plotted in the middle of the image defines the extent of that area where the lander could have come to rest. This image was created by MSSS and has been made available courtesy of NASA/JPL/MSSS/ASU. After plotting the landing site, you will see that the engineers did an excellent job of targeting the lander within the ellipse. To fit the basemap, this image was also slightly rectified but still contains some registration errors in the MOLA and MOC images.
Continued on page 3
|