ArcUser Online
The three-dimensional model presented in this article was completed during the fall semester of 2004. It resulted from approximately 80 hours of paid student work and eight hours of faculty advising. This three-dimensional model was built on a student accessible PC (Pentium 4, 3.8 GHz, 1 GB RAM) using ArcGIS ArcInfo as well as the ArcGIS Spatial Analyst and ArcGIS 3D Analyst extensions including ArcScene. Gathering DataBefore the campus features could be rendered in ArcScene, shapefiles of these features had to be created. Data for these features was gathered from several sources-AutoCAD files, orthophotos, and scanned paper maps; some data was also collected directly in the field using a handheld GPS receiver. The AutoCAD files, from an architectural plan for the campus that was previously created by an outside firm, were submitted to Brookville with permit applications for new buildings. Three detailed DXF files of the campus included locations of buildings, roads, parking lots, sidewalks, forested areas, individual trees and hedges, fences, light poles, fire hydrants, and contour lines at two-foot intervals. These files were originally in a local coordinate system but were projected into North American Datum of 1983 (NAD83) New York State Plane Long Island coordinates.
The second data source is 1' x 1' color orthophotography from 2000. This imagery, part of the New York State Statewide Digital Orthoimagery Program, can be downloaded at no cost from the New York State GIS Clearinghouse (www.nysgis.state.ny.us/). These images were used to locate features absent from the AutoCAD files, such as bus stops; orient and properly size transitory features, such as cars parked in lots; and verify features from the AutoCAD files. The data was separated into the 12 shapefiles listed in Table 1. Making a Virtual Campus
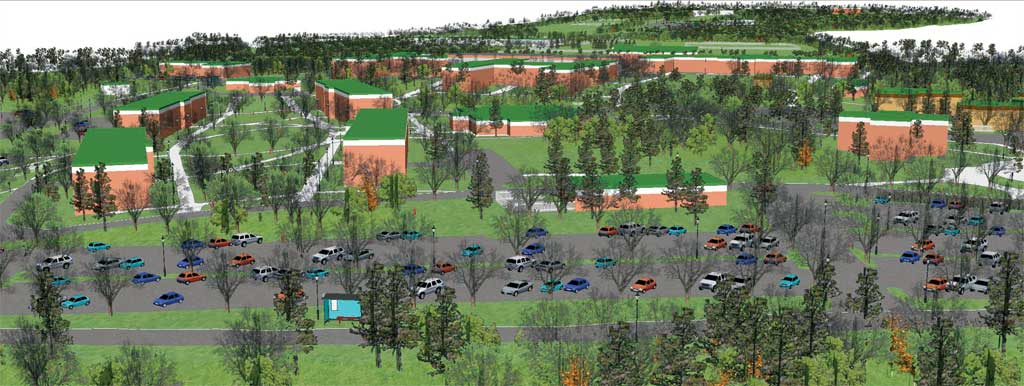
The two-foot interval contour lines provided detailed base elevation information for the entire campus. The contours were converted into a triangulated irregular network (TIN) to create a smooth, continuous surface across the campus. To create the TIN, the contours were used as mass points and the campus boundary polygon was used as a hard clip line in the triangulation process. The resulting TIN honors z-values on the contour lines; uses spot elevations (that were represented as two short, crossed line segments on the contour layer in the AutoCAD drawings); and does not extrapolate z-values outside the edge of campus where detailed elevation data was not available. Roads and sidewalks were mapped as polygons rather than lines to control the width of the roads. This also allowed surface textures, such as asphalt and concrete, to be applied in ArcScene. Parking lots, buildings, and forested areas were also mapped as polygons. Initially, these five polygon layers were symbolized with appropriate textures and colors and overlaid on the TIN on which a grass texture had been applied. However, when using this method, portions of the grass-textured TIN bled through the other polygon layers that obtained base height from the TIN. The result was that odd patches of grass appeared in places such as in the middle of a parking lot where they were not actually present. This occurred even if the parking lot polygons were offset from or extruded above the TIN. Because nearly every feature that wasn't road, parking lot, sidewalk, forested area, or building on the campus was grassy lawn, a land use/land cover layer was created that assigned all areas on campus to one of these six categories. This eliminated the display of random, phantom grass. Also, sharp edges could be displayed between adjacent features by offsetting one feature type with respect to another. For example, the roads and parking lots were offset by 0.3 meter (or approximately 1 foot) from the sidewalks, grassy areas, and forested areas to create a discrete white break between the two. In essence, this process created a virtual curb one foot high. By mapping the forested areas as polygons, points representing individual trees could be generated at random locations within the polygons. In this model, points were generated using a dot density display in ArcMap and exported as a point shapefile using a script obtained from the Esri knowledge base. Virtual forests for this campus were created using four different point files, each with a different dot density. This resulted in random point placement and the ability to use four different types of trees that produced forests with more variety: different species, sizes, and colors of trees. It was important for some point features to be oriented in a particular direction. For example, the bus stops had to face the street. To achieve this, a rotation field was added to the attribute table, using 0 to 360 degrees as the value range. Rotation values were entered for each feature that needed adjustment and used to rotate the objects in ArcScene. To give the buildings height, they were extruded based on height values from the attribute table. To capture the varying colors of the exterior walls, trim, and roofs of the buildings, two more copies of the buildings shapefile were added to the ArcScene project. The three identical building layers were then offset vertically so they would be layered on top of each other. The extrusion values for each copy of the shapefile were also adjusted so the buildings would retain their correct height. The polygons were then symbolized with colors, based on exterior color values from the attribute table. The resulting variations of colors match the general exterior colors for each building on campus. Continued on page 2 |