ArcWatch: GIS News, Views, and Insights
October 2010
Unemployment Continues to Drag U.S. Economic Recovery in 2010
Esri's 2010/2015 Updated Demographics Data Predicts Slow Turnaround for the Nation

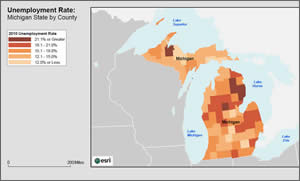
As the automotive industry struggles to rebound, percentages of unemployment in parts of Michigan continue to top 20 percent. This map of Michigan by county illustrates the pervasiveness of job loss in the state.
From the mail room to the executive suite, job loss does not discriminate among workers these days. "One step forward, two steps back" is an apt description as unemployment continues to drag the United States' economic recovery in 2010.
Organizations that use Esri's Updated Demographics, however, can get a better perspective of current and future employment trends, helping them to make decisions related to hiring, extending employee hours, and perhaps adding more temporary workers to the payroll.
While the recession seems to have abated, the job market is still trying to gain traction. In mid-2009, Esri's Updated Demographics data revealed job losses of 5.5 million from the previous year, contracting the U.S. workforce to 136.6 million people.
This year, the labor market continues to suffer losses, but at a much slower rate. By July 2010, another 588,000 people were dropped from payrolls, lowering the total workforce to 136 million. The total number of unemployed people grew to 16.5 million—representing an increase of 352,000 over last year. As a result, the unemployment rate has increased to 10.8 percent.
Esri's Updated Demographics gives businesses and government agencies the data needed to improve the quality of research and analyses related to employment trends and other topics such as population changes. Updated with benchmarked, industry-standard methodologies to provide optimum accuracy, Esri's Updated Demographics database includes more than 2,000 variables of current-year estimates and five-year projections for major demographic categories such as employment, age, income, and housing.
"Esri pays close attention to economic and social trends and how they influence the needs of business, consumers, and citizens," says Lynn Wombold, chief demographer and manager of data development at Esri. "The challenge of successfully weathering the current economy underscores the importance of having access to accurate information. Current data can track critical changes and preclude the cost of being wrong."
Data Reveals Job Losses
The white paper Esri's Trend Analysis: 2010/2015 [PDF] shows that from 2008 to 2009, jobs were lost in 95 percent of U.S. counties. One year later, collectively, half of the counties gained jobs (1.7 million, or 2.8 percent), while the other half lost jobs (2.3 million, for a net loss of nearly 600,000 jobs). During that time, unemployment rates increased in 97 percent of the counties; officially, approximately 40 percent of counties now have declining unemployment rates (these rates do not include workers who have dropped off the unemployment rolls or left the labor force).

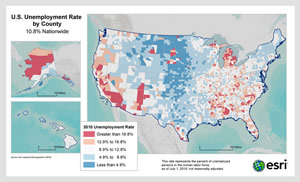
Pockets of high unemployment remain in Michigan, parts of South Carolina, and southern California. This map of the United States by county illustrates the percentage of unemployment across the country.
How does the information about unemployment translate geographically? The map of the United States by county illustrates pockets of continuing high unemployment in Michigan, parts of South Carolina and Arizona, and southern California.
However, there are a few bright spots amid the bad news. Numbers are improving slightly in the northeast, south, and west. Southern states are recovering much better than last year, and some are even beginning to post modest gains. The net increase in job creation, primarily in Texas and the Carolinas, is providing employment opportunities for approximately 60,000 workers. Jump-starting the economy in Florida and Georgia remains difficult.
The number of temporary jobs has also risen since the third quarter of 2009. When business is slow, companies typically squeeze more productivity from current employees. As business revives, firms are reluctant to increase their full-time hires but will cautiously add temporary workers. Another positive sign is the decline since mid-2009 of the four-week moving average of new and continuing filers for unemployment insurance benefits. A moving average, in statistics, refers to a method of smoothing the fluctuations that might occur in a time series to reduce the effects of random variation and reveal any underlying trends or seasonal changes.
What Does the Future Hold?
Assuming that the economy rebounds slowly and steadily, Esri's five-year forecast of the U.S. labor market shows some improvement down the road. Esri predicts that, barring any unforeseen downturns, the economy will create an additional 8.3 million new jobs between 2010 and 2015, bringing the total number of workers in the United States to 144 million. The pool of unemployed workers should shrink to approximately 14 million and the unemployment rate is expected to drop two percentage points to 8.8 percent. This prediction is part of Esri's annual demographic update estimates and projections.
Easily Use Data in Software
Esri's Updated Demographics data can be easily integrated into software and is available in a variety of formats; comes in 11 different geographies; and is delivered via a selection of media such as CD-ROM, DVD, or FTP. The data is also included in Esri Business Analyst, a suite of Web-based, desktop, and server applications that enable organizations to go beyond standard analysis by incorporating geographic location into viewing and analyzing data.
For more information about Esri's 2010/2015 Updated Demographics data, call 800-447-9778 or visit the Esri Data Web site.