How many times have you hosted your data or found someone else’s data that you wanted to use in a map, but it wasn’t exactly in the format that you needed? Or the data field you needed as a percentage was somehow shared as a string field, or the street names were typed in all caps, or perhaps the field you needed doesn’t even exist.
You would have to go back to your data, add a new field, calculate the new value, and rehost the data. Or if you had been using another person’s data, you ended up in an endless waiting game either hoping or begging them to update their service with a new data field.
But now, thanks to ArcGIS Arcade, a basic scripting language from Esri, you can map the values you need or create completely new data values in minutes. For example, if you’re accessing a data value in Celsius, you could use Arcade to quickly convert it to Fahrenheit. Within ArcGIS Online, ArcGIS Pro, ArcGIS Runtime, and ArcGIS API for JavaScript, you can create expressions for visualization, labeling, pop-ups, calculations, and aliases. You don’t even need to be a programmer to use Arcade to save time and all the usual hassle.
What Is ArcGIS Arcade?
Arcade is a simple scripting language built on JavaScript that helps you calculate new data fields on the fly. You can create an Arcade expression anywhere you can use a data attribute within your maps.
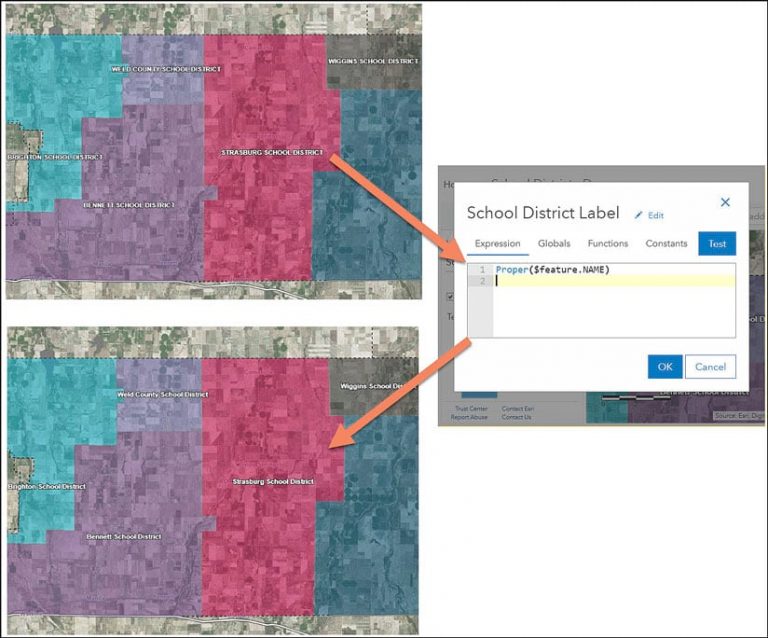
For example, suppose a GIS analyst in Colorado wants to map a school districts layer they found within their county’s organization. However, the NAME field containing the school district name is in all caps. Using the built-in function Proper(), the analyst can quickly label the school districts with neatly formatted text where the first letter of each word is capitalized.
Arcade can be used for simple conversions, like the one above, or for basic calculations like adding two fields together. But it can also calculate new data values to be used within your map using complex spatial calculations, variables, loops, and If statements. Arcade also contains geometry functions, which give you the ability to calculate areas and lengths and perform simple overlay operations.
Learn Arcade in Four Easy Steps
You’ll now write an Arcade expression to get comfortable with the interface. To follow along, open this map in ArcGIS Online and click Modify Map at the top right of the window.
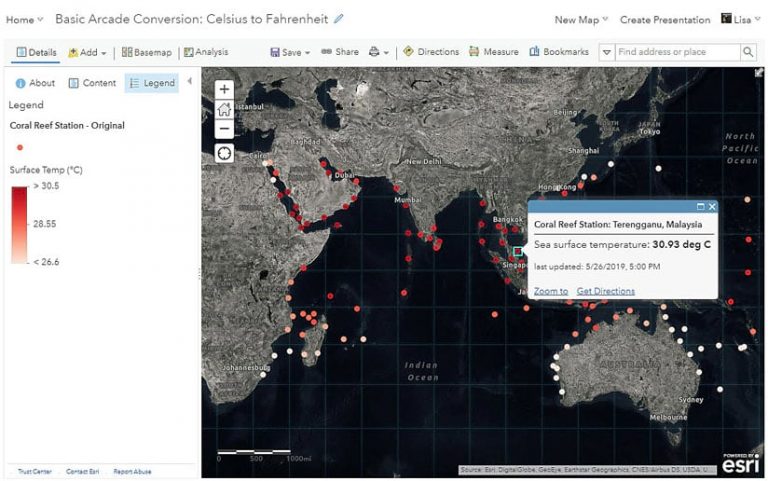
This example uses an ArcGIS Living Atlas of the World layer that shows virtual coral reef stations to help identify reefs at risk of coral bleaching. The data is in real time, meaning the data values are constantly being updated by the National Oceanic and Atmospheric Administration (NOAA). Warmer water temperatures can cause coral bleaching, so monitoring the temperature of the ocean using this data can help pinpoint reefs that are in danger. These “virtual stations” are not actual buoys or in situ stations transmitting data but rather derived reef locations from 5-kilometer resolution raster data.
The map’s legend and the pop-up show the sea surface temperature of the virtual stations shown in Celsius. Celsius is a measurement that’s widely used around the world and within the scientific community, but if the people in the map audience are based in the United States, they might understand temperature better in Fahrenheit.
Because the data comes from a live feed that is updated regularly and the layer is owned by someone else, Arcade is the perfect tool for adjusting this map to degrees of Fahrenheit. The conversion from Celsius to Fahrenheit is a simple equation:
F = C x 1.8 + 32
You can convert this data value quickly using Arcade, and because the data is updated in the layer, your map will always reflect the newest values. Let’s get started!
Step 1: Create a new expression.
Arcade expressions act as a new attribute within the map. In many of the places where you use data attributes in your maps, such as symbology, you’ll find an option to use an expression.
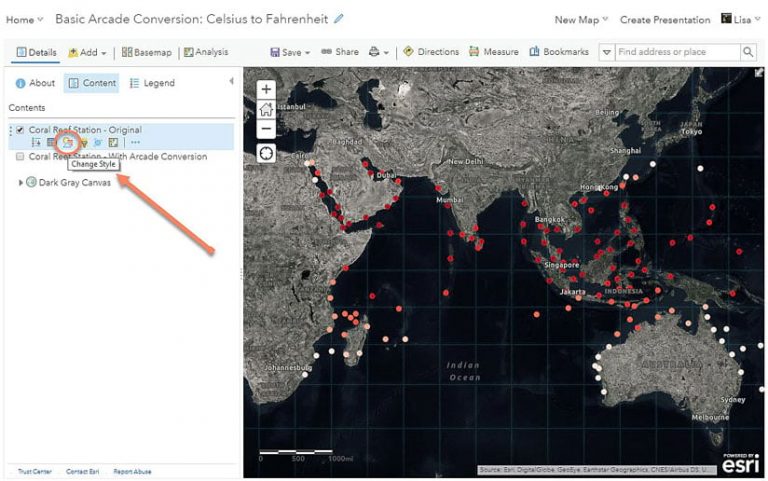
a. To use an expression for the map’s symbology, first go into the Change Style options for the Coral Reef Station – Original layer under Contents.
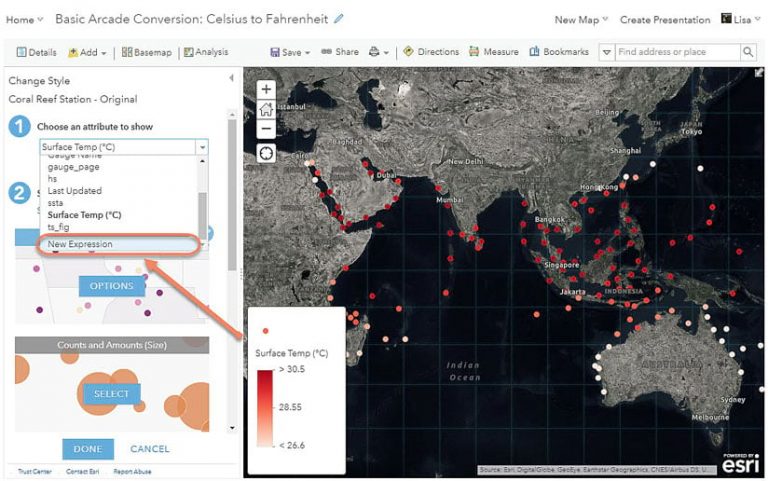
b. Select the drop-down arrow to see the layer’s attributes. At the bottom, click New Expression to open the expression window.
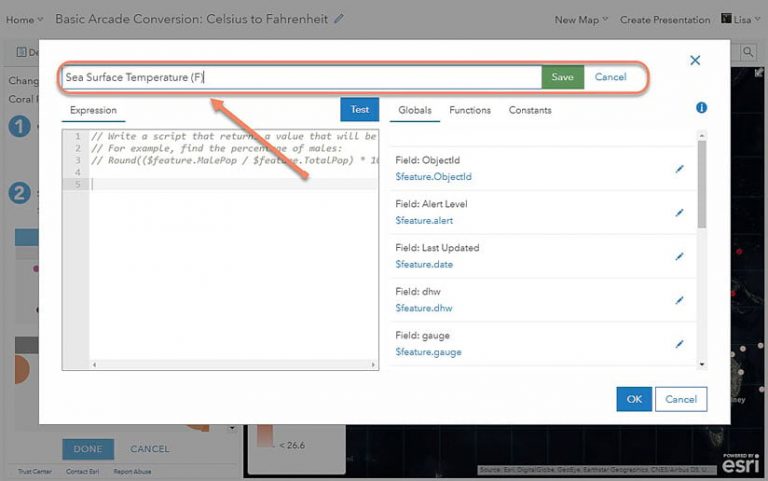
The expression window will appear, and at the top of the window you will see the default name of the expression: Custom. This will appear in the map’s legend, so it is a best practice to first name your expression something meaningful so that your map reader will understand what they are seeing.
c. Click Edit next to Custom and rename it “Sea Surface Temperature (F)”, then click Save.
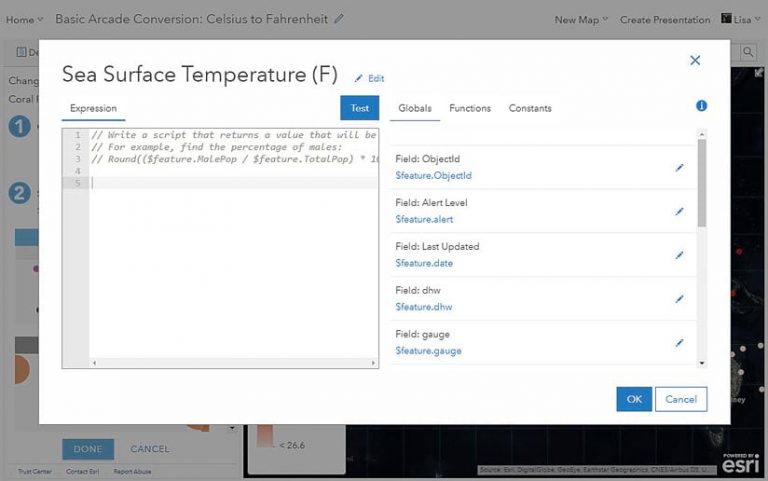
Under the word “Expression” is where you will write the Arcade expression. By default, a sample expression appears. You can delete this when writing your own expressions, but it shows what comments look like in Arcade (denoted by //).
Step 2: Use an attribute from the layer to calculate a new value.
First take a closer look at the expression window to better understand how to use it.
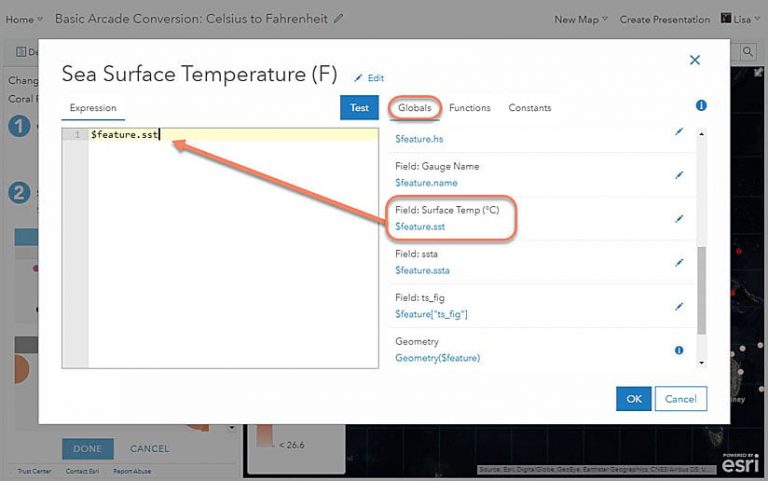
On the right side of the window, you’ll see the list of fields from your data under the Globals tab. They have $feature in front of the field name, which means that Arcade will process the expression for each feature in the map. When working with Arcade within pop-ups, you’ll see additional Globals such as $map, which is used for accessing data from other layers in a map using a function called FeatureSet().
Under the Functions tab, you’ll find a list of built-in functions, such as the Proper() function used in the previous example. The documentation for each function is accessible through this window, making it easy to learn and use new functions.
When you want to reuse expressions you have already created on a layer, they’ll appear under the Existing tab. This will only appear once you have created an expression elsewhere.
The Constants tab contains formatting tools and other universal constants such as the value of pi.
To write your expression, go to the left portion of the window.
a. On the Globals tab, find the attribute field for Sea Surface Temperature (C). Click $feature.sst to add it to the expression. The attribute’s alias appears above it as Field: Surface Temp (C).
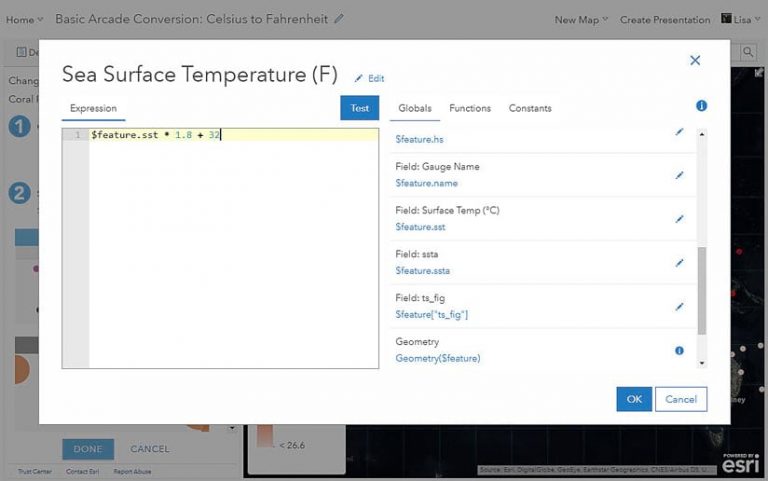
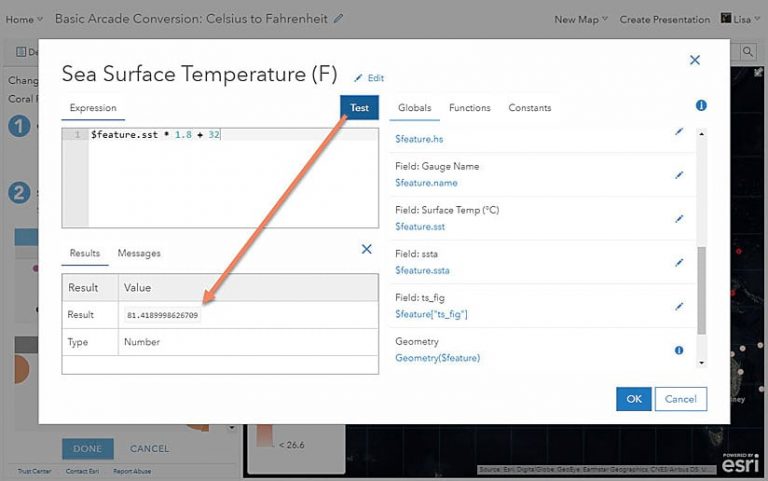
b. Now, write out the equation for the Celsius to Fahrenheit conversion covered earlier. The asterisk (*) symbol can be used for multiplication, just as in Microsoft Excel. The expression should look like this: $feature.sst * 1.8 + 32
Step 3: Test and use.
Test your expression to make sure it works. The expression will return the last line of code, meaning that if your expression is only one line, it will return the result of that line. If your expression is more advanced, you can use a return statement to control what the expression returns. Check out examples from this blog to see how return statements are used.
Click the Test button, and a console will appear with the result of your expression. In this example, the result is the number 81.4189998626709. The expression was tested using the value 27.454999923706055, which, when converted to Fahrenheit, is in fact 81.4189998626709. This means the expression worked as expected.
This result is using a value from a feature in the dataset to test, but because this data is real time and constantly updating, the result you obtain may be different than this example. To see or change the value being tested, find the attribute in the list on the right, select the pencil to the right of that attribute, and click it to see the value being used by the expression in the test and confirm that the result is correct . Now you can use your expression as if it’s a normal data attribute. Change the symbology to the Counts and Amounts (Color) option.
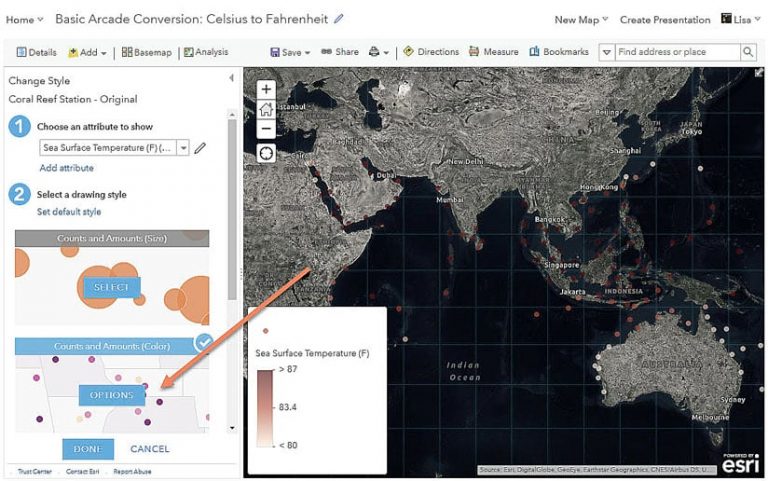
a. Click Options > Symbols > Fill and change the color ramp back to a bright red to replicate the map you started with.
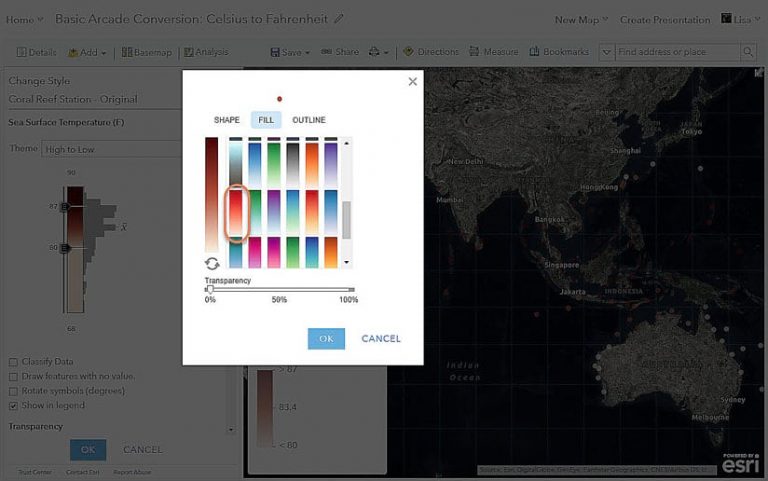
b. Move the Transparency slider to 0%, click OK, click Done, and your map is now in Fahrenheit!
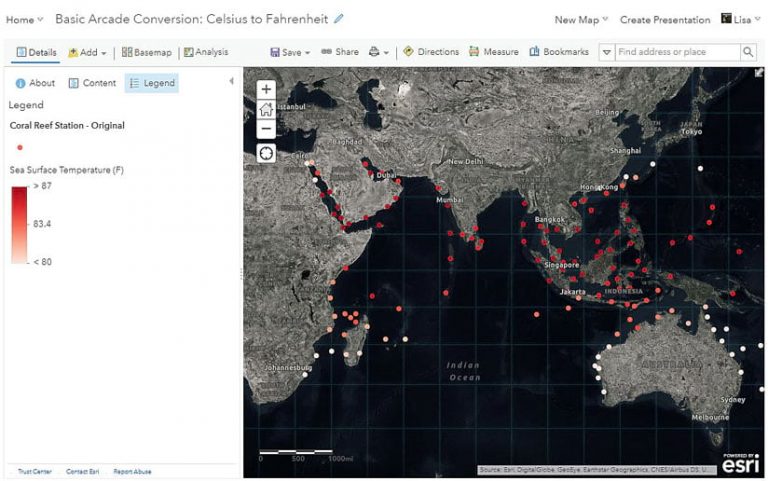
You did it! You wrote your first expression! Now, let’s reuse this expression in the pop-up.
Step 4: Use an existing expression
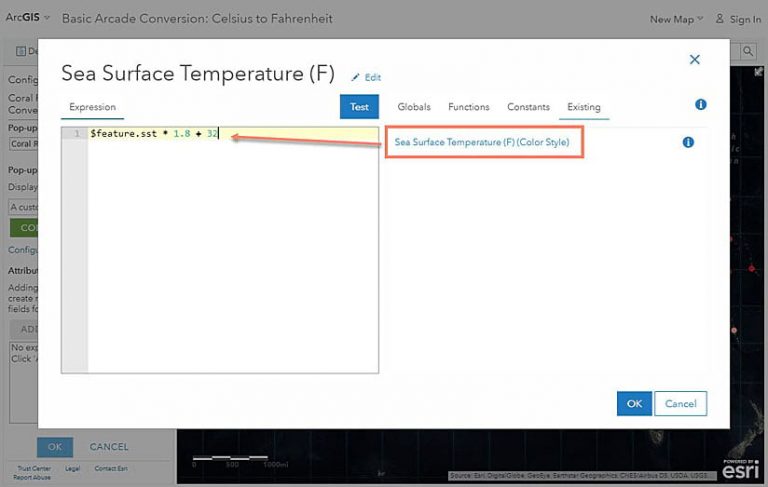
Once you have used an expression on a layer in your map, you can easily reuse it without needing to rewrite it. Go into the layer options and choose Configure Pop-up. Under Attribute Expressions, click Add. The expression window we saw earlier will appear, and now there is a new tab in the window called Existing. This contains any expressions being used on the layer. You can see the previous expression we wrote called Sea Surface Temperature (F) and it tells you where it is being used within the map (Color Style).
- Click on the existing expression and it will automatically appear within the expression window. As you did before, give the expression a useful name so that you can easily reference it later. Click Ok to save the expression.
b. Within the Configure Pop-up panel, click the green Configure button to edit the existing custom attribute display. It currently uses an attribute called {sst} which is the sea surface temperature in Celsius. Highlight {sst}, click the plus sign, and choose the expression we just added. Change deg C to def F and make the expression and reference text size small and bold.
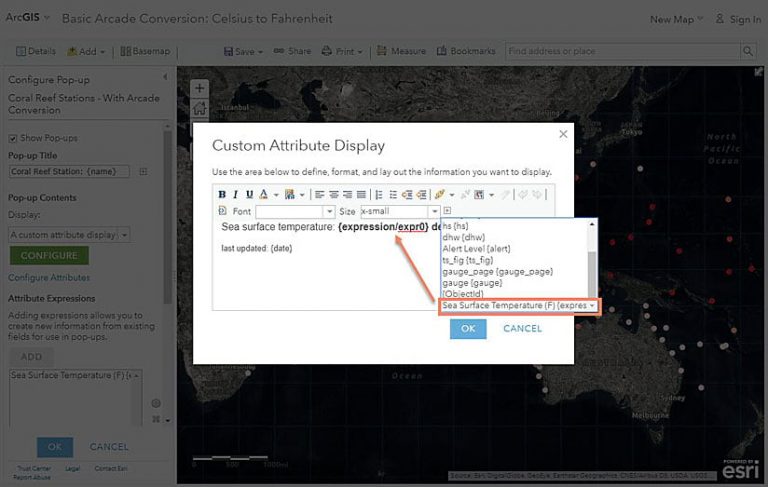
Save all your changes, and now your pop-up shows the value in Fahrenheit to match the map.
What You’ve Learned
Arcade is a powerful way to save time and do on-the-fly calculations. You no longer need to own a data layer or perform field calculations to see immediate adjustments to your data values. There are many resources to help you be successful with your own Arcade expressions. To learn more about ArcGIS Arcade, read the following articles or refer to these websites:
Getting Started with ArcGIS Arcade
Built-in functions included in Arcade
Use Arcade Expressions to Map Your Ideas
Discover patterns in your data with ArcGIS Arcade
Create Custom Labels with ArcGIS Arcade Expressions

