ArcGIS Arcade is an expression-based scripting language for data in your maps. You can use it to do basic calculations, convert field types, and configure symbols, labels, transparency, and pop-ups—all without leaving the map. And you don’t have to be a developer or GIS expert. Arcade is for anyone who wants to transform their data values on-the-fly.
A common use case for Arcade is changing the total number to a percentage.
For example, imagine you’re supporting an evacuation effort in Houston, Texas for an incoming hurricane. You need to pinpoint areas that may have difficulty evacuating in time. You have data in a map that shows the total number of households without a vehicle in each census tract. It would be more meaningful to identify the tracts with a high percentage of households without a vehicle based on the total population.
By writing a basic Arcade expression, you can easily change the total number to the percentage of households with a vehicle. And don’t be intimated by the idea of creating expressions! Arcade guides you along the way.
Here’s how you use Arcade to show the percentage of households without a vehicle.
This workflow uses Map Viewer Classic.
Style the layer using Arcade
1. Open the Houston households map, sign in with your ArcGIS account, and save a copy of the map.
2. Point to the Houston Demographics layer and click Change Style.
3. For Choose an attribute to show, choose New Expression.
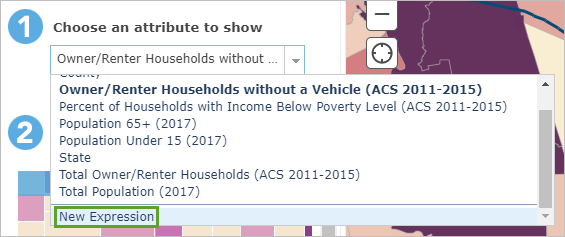
4. Next to Custom, click Edit, type “Households Without a Vehicle (Percentage)”, and click Save.
5. On the Globals tab, for Field: Owner/Renter Households without a Vehicle (ACS), click $feature[“OwnerRenterHH_NoVehicle”].
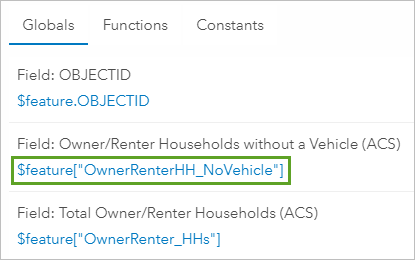
6. In the Expression tab, click the end of the expression and type the division sign: /. (A forward slash is the sign for division.)

7. On the Globals tab, scroll through the list of fields and click $feature[“OwnerRenter_HHs”].
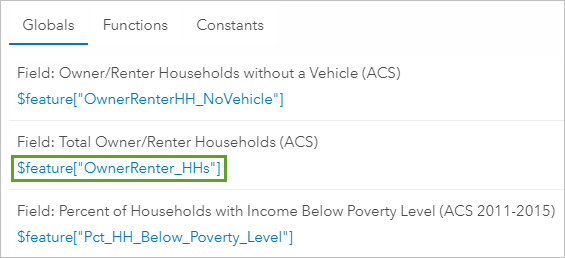
Your expression divides the number of households without a vehicle by the total number of households. To get a percentage, you’ll multiply the results by 100.
8. Add a set of parentheses around your expression and after the second parenthesis, type *100. (An asterisk is the sign for multiplication.)
Your expression should now be: ($feature[“OwnerRenterHH_NoVehicle”]/$feature[“OwnerRenter_HHs”])*100
9. Click Test to make sure you didn’t make an error.

The result of your test is a value with a large number of decimal places. You’ll want to simplify the results by rounding to two decimal places.
10. Click the Functions tab, search for Round, and use the Round function to create the expression Round(value, numPlaces), where value is your current expression (the number to round) and numPlaces is 2 (the number of decimal places to round).
11. Click in front of your expression and type round(, click after your expression and type ,2)
Your completed expression is: round(($feature[“OwnerRenterHH_NoVehicle”]/$feature[“OwnerRenter_HHs”])*100,2).
The result now has only one decimal place.

12. Click OK to see the results of your expression on the map.
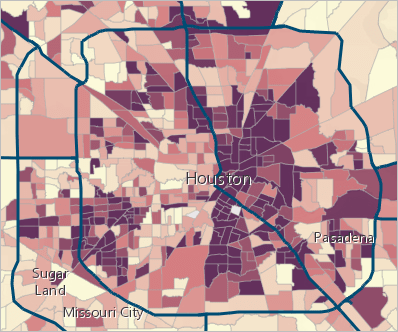
The layer style updates on the map. Now each census tract size is based on percentage instead of total numbers, but tracts are styled by size. You’ll change the style to use color instead.
13. In the Change Style pane, for Counts and Amounts (Color), click Select.
Darker colors represent census tracts with a higher percentage of households without vehicles. The default color ramp makes it difficult to see the evacuation routes. You’ll change the color ramp so the routes stand out.
14. For Counts and Amounts (Color), click Options. In the more advanced options, click Symbols.
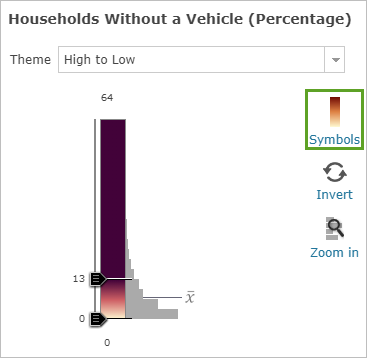
15. For Fill, in the color ramp selector, click the blue-to-gray color ramp.
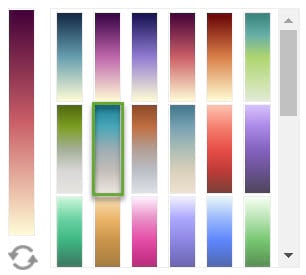
16. Click OK, click OK, and click Done to apply the new color ramp to the map.
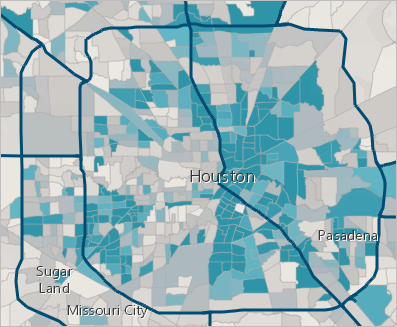
In this map, census tracts with a higher than average percentage of households without a vehicle stand out in blue. A pattern of limited access to vehicles stands out in downtown Houston. These census tracts would likely benefit the most from increased evacuation assistance.
Customize the pop-up with your Arcade expression
The Households Without a Vehicle layer has preconfigured pop-ups. However, the layer’s pop-up was configured to show total number of households without a vehicle. Because you styled the layer with percentages, you’ll customize the pop-up to include the percentages you calculated with your Arcade expression.
1. In the Contents pane, point to the Households Without a Vehicle layer. Click the More Options button and choose Configure Pop-up.
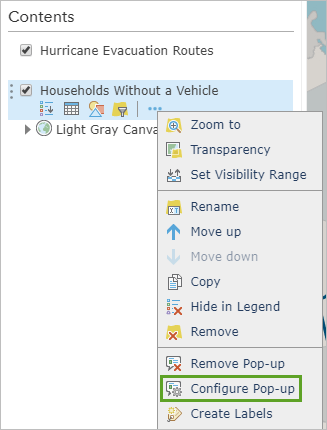
The Configure Pop-up pane opens. The only thing you’ll add to the pop-up is your expression.
2. For Attribute Expressions, click Add.
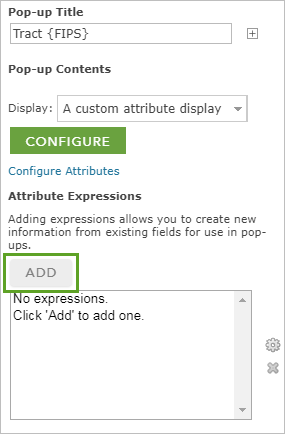
You’ll add the Arcade expression you already made.
3. Click the Existing tab.

4. Click Households Without a Vehicle (Percentage) (Color Style), change “Custom” to “Households Without a Vehicle (Percentage)”, click Save, and click OK. Your expression is added to the Attribute Expressions list.
5. For Pop-up Contents, click Configure. In the Custom Attribute Display window, click the end of the existing text and press Enter twice. Click the Add field name button and choose Households Without a Vehicle (Percentage).

The expression is added with the name expression/expr0.
6. After {expression/expr0}, add a space and type percent of households in this tract do not own a vehicle.
7. Highlight the expression and text you added and click the Bold button.
Your custom attribute display is complete.

8. Click OK, click OK, and save your map.
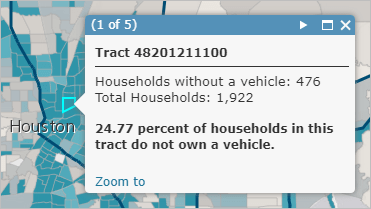
The pop-up now includes the percentage of households without a vehicle.


Article Discussion: