
Michael Batty explains how the process of geodesign might be compared to one in which conflicting views about a spatial design can be systematically resolved in moving to a solution by using a simple network model of conflict resolution. Such models assume two sets of agents—designers or stakeholders, as well as land parcels or locations—incorporated with attributes of suitability that the stakeholders use to reach a consensus over the best design. He illustrates the idea with a “toy” problem of the redevelopment potential of eight sites in central London that are influenced by six distinct stakeholders.
There are now many new methods for modeling cities that differ from the traditional approaches to simulating urban structure, land use, and transportation flows. As data has become richer and bigger and computers have become all-pervasive, with ever-increasing memories and ever-faster processing times, it has become possible to model the behaviors of individual objects that make up data aggregates, such as populations, that were the focus of simulation models a decade or more ago. Individuals that compose these populations can now be represented as distinct objects within computations, now usually being referred to as agents. Agents are essentially individual objects that have to be well-defined with strong identities and distinct from the environment in which they sit. These might be likened to the “atoms” that compose our cities, notwithstanding that what goes on inside the atom is hidden from our view. Although in cities agents are often considered to be human beings, it is quite possible to define them in terms of any distinct objects that compose a system. In particular, agents might be streets or buildings, components that make up the weather or vehicles on the highway, the bricks that a house is built from, or the pipes/wires that click together to keep our utilities functioning. Their definition is entirely dependent on the context, and in this sense, agent-based models or modeling (ABM) has emerged as a much more generic tool for simulation than most of the other approaches developed hitherto. Indeed, Esri has introduced a plug-in called Agent Analyst that enables users to build agent models that have a spatial component, which is the map in ArcGIS.

The easiest way to introduce ABM would be to illustrate a model of moving cars on a highway or pedestrians on a street. Agents in this case have mobility, and the focus of simulation would be the dynamics of how they behave and how they cluster and spread out. There are many models of this kind linked to spatial environments that are presented using GIS. But here we will change the focus and develop a model for illustrating how the agents who are actually involved in the design process itself communicate with one another in the effort to reach a collective decision. Our model will be about how designers design rather than how they use their knowledge of cities and their environments to generate decisions. We are thus transferring our focus to the design and decision process itself, and we will show how a model can be built that enables us to articulate the way those involved in design communicate and pool their ideas and opinions about what is the best design.
In fact, the model of how geodesigners or the stakeholders who are involved in the design and decision process communicate with one another is rather simple to explain. Essentially, we assume there is a network of relations between stakeholders, which is a structure based on how close, in terms of ideas about the design problem, they are to one another and how likely they are to communicate. The network connects everyone to everyone else, some directly, but most indirectly. The process works as follows. At each time period, those agents who are connected to other agents send their opinions to those agents to whom they are directly connected across the network. When the agents receive the opinions of those to whom they are directly connected, they make a rational compromise: they change their own opinions to an average of those they receive. They then take these new averaged opinions and communicate these using the same network at the next time step. They then average the averages in the second round. If they keep doing this, the initial differences between the agents will be reduced, and eventually everyone will hold the same opinion. Consensus reigns in the form of a weighted average of all the differing opinions. If the problem is suitably framed, then this consensus can be seen as the design solution.
Of course, you might object that in any design problem, this kind of consensus could not be ensured. Links in the network might be absent, meaning that some agents never pass their opinions to others. If opinions are passed, the agents may not decide to consider them. There are many ways in which communication may fail or be blocked, distorted, or manipulated. But if a design is to result, then some sort of compromise of conflicting or differing views about the best design must occur. Moreover, this idea of a network could be the basis for the design of a process that would achieve consensus—that is, of designing a network that enables the right kinds of communication to take place from which the best solution is guaranteed. Now this, of course, is an ideal type. This model of agents who are geodesigners in the broadest sense of the word is what we might hope for, but it can be made operational, and it is a point of view that forces us to consider how geodesigners design and converge to an agreed solution.
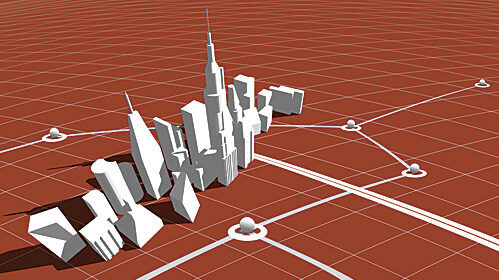
To illustrate it, let me pose a hypothetical problem that we have studied in London’s financial quarter, or the “square mile,” where we have identified a typical problem of change and redevelopment of land use and building form that requires the agreement of several key stakeholders. This involves a cluster of buildings composed of residential, commercial, and hospital uses where we show and label the sites in question in the above illustration. This is a toy problem, but it could easily be scaled up to include many building parcels and land uses and many different stakeholders. As in any specific context, the model only comes into its own as a useful way of exploiting geodesign once we do scale up, and thus our toy model simply illustrates the method.
The area for our design is around the original location of the central post office adjacent to St. Paul’s Cathedral and the new London Stock Exchange in central London. This is the notional center of the UK postcode districts. Here, Marconi sent the first public wireless signal in 1896, and John and Charles Wesley founded Methodism in 1738 in the street known as Little Britain. The area is composed of eight key sites: the Bank of America/Merrill Lynch and Nomura Bank, which occupy two of the old post office buildings sold off to the private sector in the last 20 years; a residential block built recently; two buildings of St. Bartholomew’s hospital, one of these just reconstructed and one ripe for redevelopment; a small Georgian church called St. Botolph’s; a large commercial block recently developed; and a pocket park of enormous charm. If you want to look at the problem more graphically, then see the PDF of my slides given when I presented a similar talk at the recent 2013 Geodesign Summit. We can now define six key interest groups—stakeholders—that all have some stake in whether or not these eight sites need to be redeveloped and/or change their use, which would involve some alteration to their building fabrics. The stakeholders are the hospital, in the form of the National Health Service; the residents; the banks; property speculators who continually dwell on high-value sites, such as those in this problem; developers anxious for lucrative redevelopment contracts; and the City Corporation (the municipality), which acts as the basic arbiter of all development in the city. Now each of these agents has a view about whether or not each of the eight buildings should be converted or redeveloped. If we then record these views as being in favor of change (1) or against it (0), then we can assemble a matrix or table where the rows are the stakeholder agents and the columns are the land parcels or sites, a second and different set of agents. We can show this level of interest as in Table 1 below, where each row is the interest (1) or disinterest (0) the relevant stakeholder has in the redevelopment potential of the building parcel.

Now, this matrix or table contains all the salient information about the design problem. This, in fact, is a set of maps. If you look at the table from the vantage point of each stakeholder—across each row—then each is a map of what the stakeholder thinks should be done in each parcel. One could easily imagine each row as constituting a set of grid squares from a 2D map splayed out as a vector rather than a grid or other 2D arrangement of sites. The second problem is defined when we look at each column, which is a set of what each stakeholder’s interest is in any particular site.
Now, the problem as we posed it involves each stakeholder taking the map and pooling it with those to whom they are connected in a network. However, we have not yet been at all specific about what the network is, but one way of defining it is from the above matrix. If we pose the question, How related are each of the stakeholders to each other with respect to their maps? then we could relate each row/stakeholder to any other by simply counting the number of common links. We can arrange this as an interaction matrix, and this can act as our communications network, with the strength of the links giving the importance of the communication for the pooling or averaging of maps. To give an idea of this interaction, the network between the stakeholders can be easily derived by counting in the way I have explained as shown in Table 2.

The sums (∑) of the interactions given at the end of each row must be divided into the entries to get the fractional network weights. Now for the action—for the way the agents interact in moving to a consensus. We can swap each map (row in the initial matrix) for all the other maps linked to each agent in the network mentioned above and then average these maps—the opinions of stakeholders to whom each agent is linked—using the strengths of the links as weights. So for the City Corporation, the new averaged map showing the corporation’s new interest in the sites is formed by setting the weights proportionally to the strengths of the connections. So this would be 3/14, 1/14, 3/14, 3/14, 3/14, and 1/14, noting that these weights add to 1 to make the average of the maps of the stakeholders to which the corporation is linked. If we keep on averaging for all stakeholders in this manner, then eventually each map will converge to the same interest that each stakeholder shows in each site, and this would converge to the following values of interest, where we note that we have scaled these degrees of interest in each of the eight sites to add to 100: 7, 7, 18, 7, 14, 21, 5, and 19.
Now, this decision process gives us weights that each stakeholder can apply to produce an average map. But there is another process we might consider as the dual that involves us in averaging each site against each other site in terms of the weight associated with each stakeholder. We count the number of common stakeholders with respect to each pair of sites from the first matrix above, and this gives us another network—a dual network—which is generated as strengths of interaction between the sites. In this sense, the site might also be seen as an agent. If we average on sites with respect to the different views of stakeholders, eventually the same sort of convergence occurs, and we can then find the importance of each site as making up the consensus of the stakeholders. The values we get for each of the stakeholders from the averaging of sites when consensus is reached is as follows, noting again that the values are scaled to add to 100: 17, 6, 17, 23, 25, and 10.
What all this means is as follows: For the first problem—the so-called primal—we work out a probability that each site should be redeveloped for change of use, which is agreed by all stakeholders, and this occurs when they reach a consensus by successfully changing their degree of interest sequentially. For the dual problem, each stakeholder is given a degree of importance in the problem, which is due to the fact that there is convergence on the value of each site.
Now, I appreciate that this is a huge mouthful of ideas to absorb. I have not produced many graphics here to explain it blow by blow, but the map above shows the eight sites in question as land parcels and their relative importance and also tables of the stakeholders and their relative importance in determining the importance of the sites. What this shows is that the property speculators and developers have much more importance in influencing the outcomes of redevelopment than the residents or even the banks. In terms of the eight sites, the most important with respect to a change of use are, first, the banks that acquired the old post office sites and are now subject to financial problems—hence their current decision to lease out these buildings—and second, the old hospital site. The Georgian church is protected, and there is little enthusiasm to redevelop the newly developed hospital site, the existing Aldersgate offices, and the residential block, all of which have been renovated and/or rebuilt in the last 15 years. The park is intriguing, as there is more than a little interest in changing its use, for it appears the property and development interests are central in this. This is, however, unlikely to happen, as it is one of the most highly protected pieces of green space in the city, with more than a few historic associations.
What we have produced is a model of how we can articulate stakeholders and the sites they are interested in as two different sets of agents that interact within themselves as well as between. The model we have suggested is rather simple, but it does focus on what it might take to engender important changes in how these kinds of problems might be resolved. Of course, the problem can be formalized mathematically, and although the algebra is not difficult, it is needed so that one can work out weights and averages. The real power of this approach, however, is in dealing with big problems where it is not obvious how powerful interests might be or how important sites might be. If we have hundreds of stakeholders and hundreds of sites linked spatially, the sort of networks that might apply can be extremely tricky to explore. Moreover, in such problems, consensus is often difficult to achieve without ensuring that certain communication channels are put in place. This, then, is the process of geodesign. Our argument here is that it is important in advancing this science that links GIS and design to build models not only of the subject matter and focus of the design but of the design process itself: models not only of the product but also of the process.
Most of the software that is being developed for geodesign lies more in the geo component of GIS than in the design component. But the process we are suggesting as good geodesign practices is a kind of map algebra, and it could be implemented as a way of combining land coverages within software, such as ArcGIS using the ModelBuilder toolkit. If we think of stakeholder maps as different land coverages, then the process of combination is similar to many overlay map techniques central to land suitability analysis. I am not suggesting that we should use GIS in this way, although it would be easy to add this into such generic software. But I think that formal models of the geodesign process are useful as thought experiments about how one should go about design, and they clearly suggest ways in which stakeholders with very different interests might come to some sort of agreed answer.
Note: A version of this paper was presented at the 2013 Esri Geodesign Summit, held January 24–25, 2013. A PDF of the presentation is available at www.spatialcomplexity.info archives/1109.
About the Author
Michael Batty is Bartlett Professor at University College London and chair of the Centre for Advanced Spatial Analysis (CASA).
