ArcGIS Online has several powerful extensions that help users supercharge their cloud-based mapping and analysis workflows and boost productivity. These extensions seamlessly integrate with ArcGIS Online, making it easier to do things like work with real-time data and imagery and engage with community members.

Recent updates to ArcGIS Online included new features for five of these extensions. Read on to find out more about how to incorporate these new capabilities into your work.
Make Insightful Decisions Based on Real-Time Data
ArcGIS Velocity is a cloud-native real-time and big data software as a service (SaaS) solution that allows organizations to ingest, visualize, analyze, and act on data from sensors and asset trackers. It also enables organizations to process high volumes of historical data to gain insight into patterns and trends and discover anomalies.
In 2022, ArcGIS Velocity users gained access to more feeds and analytics. Users with ArcGIS Velocity Standard subscriptions can now run up to 10 feeds and analytics, and users with ArcGIS Velocity Advanced subscriptions can run up to 15 feeds and analytics. Several improvements have also been made to keep users better informed of subscription management needs. For example, the feed data rate notifications that users receive now clarify the specific feeds that are exceeding maximum data rates.
Several enhancements have been made to the feeds, outputs, and analytics in Velocity as well. Users can develop integrations for real-time data providers that aren’t supported out of the box by leveraging the gRPC feed type, a high-performance, open-source remote procedure call that pushes real-time data into ArcGIS via a hosted endpoint. Dynamic geofencing, which was also recently released, helps support users that need to find relationships, perform spatial enrichment, and make decisions based on the spatial proximity between two real-time feeds. Tools that support these capabilities include Detect Incidents, Filter by Geometry, Calculate Distance, and Join Features.
Engage Community Members with ArcGIS Hub
With ArcGIS Hub, organizations can leverage the data and technology they already have in ArcGIS Online to work with internal and external stakeholders on particular projects and wider initiatives.

Improvements have been made to certain types of gallery cards, which Hub users employ to display datasets, related apps, and additional sites and pages. Map and iframe cards can now be shared in addition to app cards. Within these cards’ settings, there are two new options: Enable Sharing, which can be toggled on or off, and Button Always Visible, which keeps a button visible when toggled on. When the Enable Sharing button is toggled off, the Share button only appears when hub site visitors hover over the item. And when visitors click the Share button, they’re able to copy a link (to share with others) that goes directly to that card on the hub site.
While site owners and creators have already been able to expose catalog and collection metadata in standardized and interoperable formats, such as DCAT-US 1.1 and DCAT-AP 2.0.1, Hub now supports RSS 2.0 feeds. This enables site visitors to more easily see daily changes to a site’s content. Site creators and owners can also now set domain redirects when editing or changing their site’s primary domain. This ensures that community members can access hub sites without any discrepancies when the primary domain address has been altered or changed.
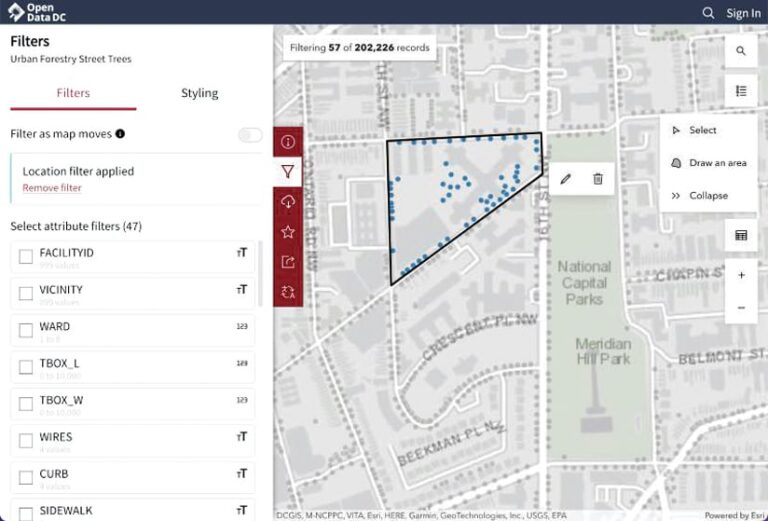
Lastly, there are several new ways for users to explore and interact with data when viewing a dataset on a map. Two new buttons on the right side of the screen are Select and Draw an area. These allow site visitors to filter data by point or polygon; draw buffers around points and polygons; and use the new polyline draw tool, which lets users draw a line on the map, select to filter by area, and set a buffer size using various units.
Simplify How Stakeholders Work with Imagery
Imagery and raster data enable decision-makers to see what’s happening on the ground and immediately understand change. But imagery data takes up a lot of space and comes in a variety of formats, so people often find it difficult to work with for the following reasons:
- It’s time-consuming and expensive to procure the imagery and set up the infrastructure.
- It’s hard to manage and normalize imagery for use in analytical workflows.
- It’s difficult to stay on a budget as data volumes increase.
ArcGIS Online, however, offers an easier and more seamless way for organizations to use imagery. The ArcGIS Image for ArcGIS Online extension allows organizations to host, analyze, and stream imagery and raster collections without leaving ArcGIS Online.
Once the imagery is in an organization’s system of record, users and stakeholders have direct access to the data and can use it to do the following:
- Run image and raster analyses at scales that range from the specific site to the entire globe.
- Detect change, inspect assets, monitor vegetation, trace water flows and plan routes and networks.
- Share data and analysis results with internal and external stakeholders as interactive apps, dashboards, and reports.
ArcGIS Image Online is a premium user type extension that adds image hosting, analysis, and streaming capabilities to the Creator and GIS Professional user types. While storage and analysis consume credits, this approach can also put unused credits to work, saving organizations the cost of standing up and maintaining their own infrastructure.
To find out how one small company, Esri partner Skytec, incorporated ArcGIS Image Online into its business operations, see “SaaS Imagery Solution Helps Conservation Startup Detect Change Faster.”
Try New and Improved ArcGIS Solutions
ArcGIS Solutions consists of industry-specific configurations of ArcGIS that align with users’ business needs and are quick to set up and deploy. They leverage users’ authoritative data and are designed to improve operations, provide new insight, and enhance services across industries that range from utilities and telecommunications to government and public safety.

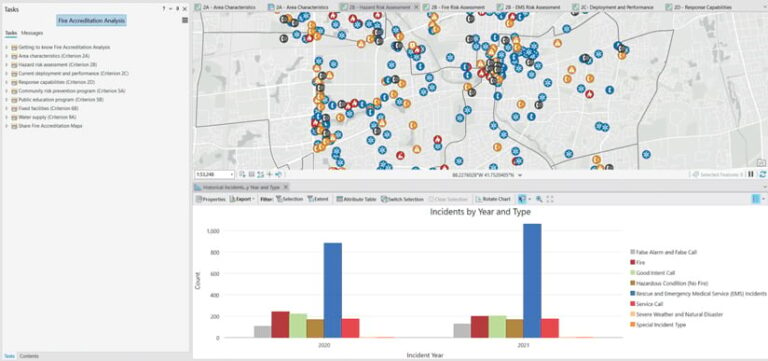
In July, the new Fire Accreditation Analysis solution was released. It can be used to complete spatial analysis workflows and generate fire maps that conform with requirements set forth by the Commission on Fire Accreditation International (CFAI). The July release also included enhancements to existing solutions across the industries that ArcGIS Solutions supports, including 3D Basemaps, Crime Analysis, and Tree Management.
Explore all ArcGIS Solutions configurations and read about their capabilities. Then sign in to ArcGIS Online to deploy them.
More Options for Designing and Presenting 2D and 3D Plans
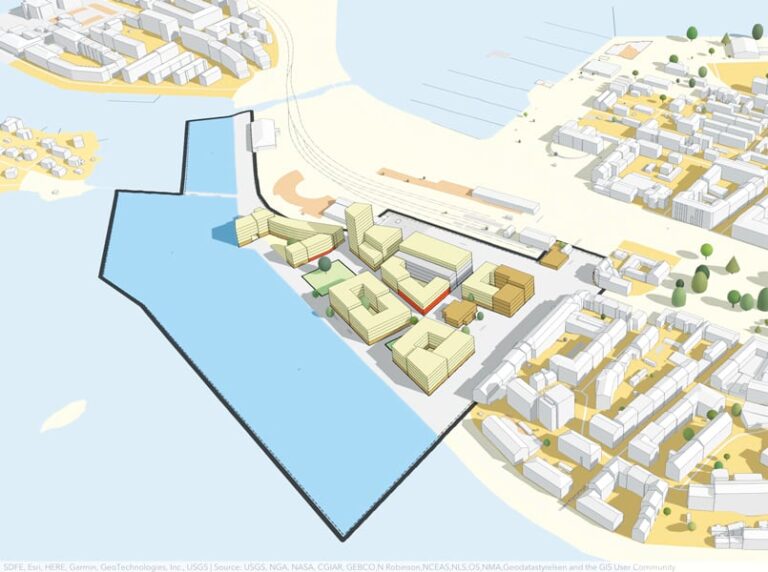
ArcGIS Urban gives planners the ability to model 2D and 3D maps of their community’s zoning codes, land-use codes, and physical structures to provide context for new development projects. When these models are shared beyond the planning department, they give stakeholders and the public the ability to preview proposed changes to their community and provide feedback on them.

Now, planners have more styling options when applying zoning and overlays to 2D maps, including custom colors and outline styles. Planners can also bring back buildings previously deleted from the maps, undo the merging of two parcels, and change a zone back to its previous type.
In planning for community development, planners often use site suitability analyses to find optimal locations for future housing, schools, and open space. But compiling these analyses can be costly and time-consuming. The ArcGIS Urban suitability tool offers an alternative to compiling disparate documents and spreadsheets. Instead, ArcGIS Urban generates on-the-fly calculations based on existing and proposed zoning conditions. Recent updates to this tool make it easier to compare various options, giving users the ability to copy and run multiple analyses of the same suitability model.
When plans and projects are ready to be reviewed by external stakeholders, planners have new ways to create presentations of their urban models. With the new viewpoints functionality, they can capture the most important perspectives in a design and create a predefined sequence to guide viewers from one viewpoint to the next.
Planners can also export their urban models directly as web scenes for use on external websites, in ArcGIS StoryMaps stories, and in presentations. Details about a specific project or plan—including a thumbnail image, links to external web content, and project start and end dates—are now accessible alongside the project’s dashboard and comments section. This gives the public a single touchpoint for viewing plan and project information and providing feedback.
Lastly, planners and GIS teams can use the new ArcGIS Urban API to write and read aggregated data from their urban model’s system of record. This allows them to extend the functionalities of ArcGIS Urban.

