A rowdy rivalry over dinosaur bones involving spies, sabotage, stealing, and sloppy science? It sounds like a madcap movie plot, but it’s a case of history being stranger than fiction. Colorado’s Bone Wars, also known as the Great Dinosaur Rush, is one of paleontology’s wildest stories—and one that lives on in a new interactive map that was commissioned by a Colorado city and created with ArcGIS Experience Builder in ArcGIS Online.
From 1877 to 1892, scientist Othniel Charles Marsh at Yale University (known as Yale College until 1887) and his nemesis, Edward Drinker Cope at the Academy of Natural Sciences of Philadelphia, raced to see who could acquire the most dinosaur bones. Bribery, theft, and even the destruction of bones were among the approaches they used to outdo each other.
Marsh and Cope were financially ruined by their efforts, but they made important contributions to paleontology, including leaving behind many boxes of fossils after their deaths. Their work led to the discovery of more than 130 new dinosaur species and raised public interest in dinosaurs, helping fund fossil excavation across North America and beyond in the decades that followed.
A Quarry, a Museum, and a Map
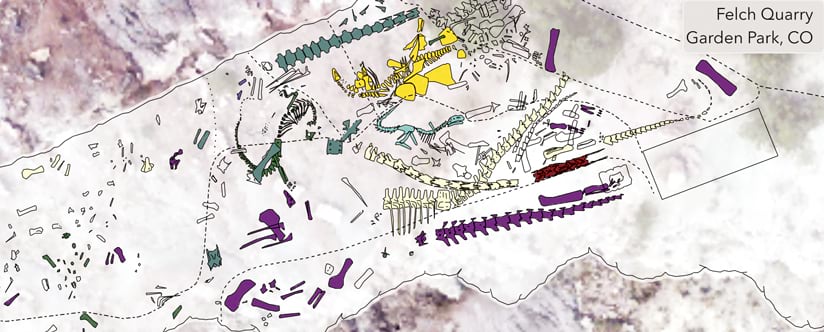
The Marsh-Felch Quarry in Cañon City, Colorado, was a rich source of fossils for Marsh, providing hundreds of boxes’ worth of bones. The Garden Park Fossil area, where the Marsh-Felch Quarry is located, is one of the largest sources of Jurassic period fossils in Colorado, making Cañon City a key stop for Colorado’s fossil tourists. A wide range of dinosaur species has been found in the quarry, including examples of Colorado’s official state fossil, the stegosaurus.
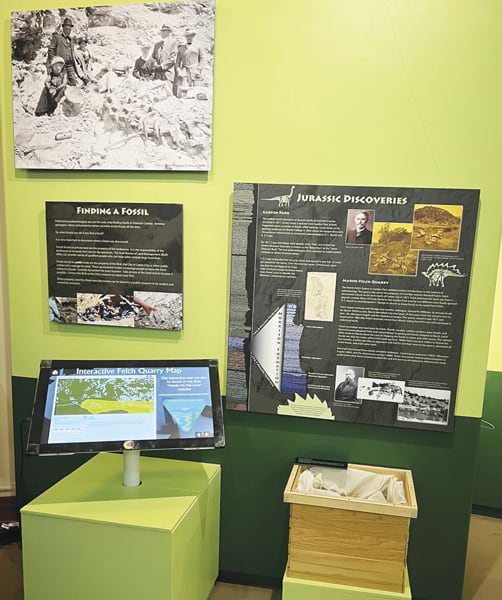
A plan to modernize the visitor experience at the Royal Gorge Regional Museum & History Center, commissioned by Cañon City and funded by the US Bureau of Land Management, shows Cañon City’s passion for being a paleontological host and educator. In the museum’s Digging It! Fossil Finds of Fremont County exhibit, an upgraded GIS-based map—navigable by touch screen—shows additional information about fossils discovered in part of the Marsh-Felch Quarry.
Partly based on an original source map created by quarry property owner Marshall Felch and paleontologist Ken Carpenter in 1994, Esri partners Argis Solutions and Platte River Analytics built an accessible, interactive map using Experience Builder in ArcGIS Online. It replaces a map that used outdated software. ArcGIS Online was recommended for the project due to the stability and scaling it offers for public access.
-
Colorado’s Royal Gorge Regional Museum & History Center provides new, interactive maps of a nearby archaeological site.
From the source map, four different maps were created for fossils in the exhibit. When a fossil is selected, the user can view information about the current location of the fossil (for example, the Smithsonian Institution in Washington, DC), an image of the dinosaur the fossil is from, the year the fossil was located, and drone imagery showing the fossil’s original location in the Marsh-Felch Quarry. Thematic colors and shades that are compliant with the US Americans with Disabilities Act were chosen for optimal visitor accessibility.
“The major goal for the Royal Gorge Regional Museum & History Center with this project was to provide a better understanding of the importance of the paleontological resources found in the Royal Gorge region related to the science of paleontology,” said museum director Lisa Studts. “What better way to do that than to design a layered interactive map of a historic fossil quarry?”
There are plans to add the interactive map to the museum’s new website as part of its updated Hands on the Land pages, which were originally produced by the Bureau of Land Management Royal Gorge Field Office and the National Environmental Education Foundation. These pages were archived in 2020. The new website is scheduled to launch in spring 2024.