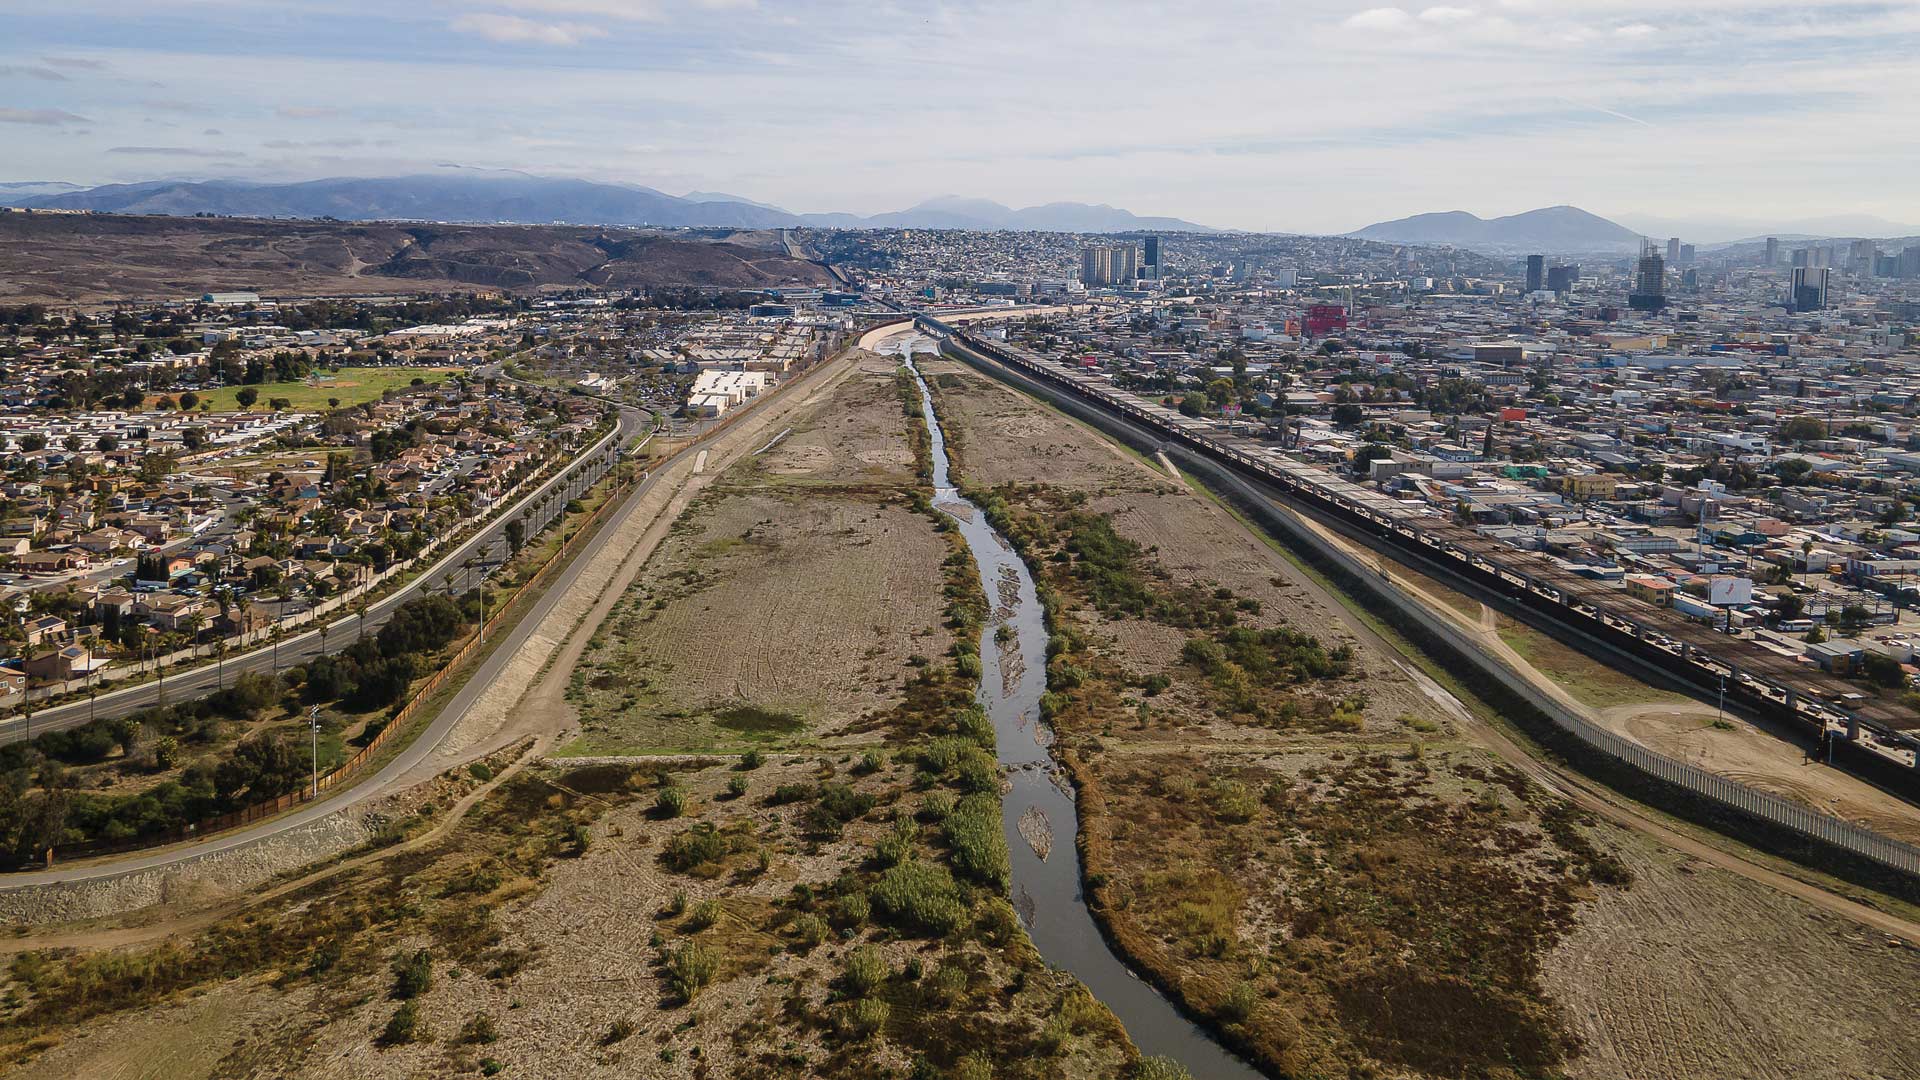
The Tijuana River travels for more than 120 miles through Mexico before crossing into the United States at the Tijuana River Estuary and flowing into the Pacific Ocean.
Toxic waste and raw sewage have polluted the estuary and adjacent beaches for decades. This is the result of failing treatment systems and poor sewage and industrial waste disposal in Tijuana. The American Rivers foundation estimates that the quantity of discharged effluent is 35–50 million gallons per day. It lists the Tijuana River as one of the most endangered rivers in the United States.
The population of Tijuana is about 2.3 million, while north of the border lies San Diego, California, with nearly 1.4 million residents. The health and quality of life for these 3.7 million people are directly impacted by this on-going toxic discharge.
That’s why several organizations have come together and employed advanced GIS to identify key issues along the river and prioritize sustainable interventions that have a good chance of being funded. They’ve also created a GIS-powered app to evaluate the effectiveness of these interventions and share information with stakeholders and the public.
Altogether, it’s a novel way to approach environmental risks that span international borders.
, and a horizontal bar chart.")
Organizations with Similar Goals Come Together
In 2024, the San Diego/Tijuana region was the first-ever cross-border area to be designated the World Design Capital (WDC) by the World Design Organization, an international nongovernmental organization that promotes using industrial design to support a sustainable environment and an engaged society. This region’s appointment as WDC 2024 sparked dialogue and surfaced shared priorities for addressing the Tijuana River’s environmental and economic challenges.
Arup, a global multidisciplinary consulting firm with deep expertise in digital and geospatial analysis, was invited to participate in the WDC 2024 Climate and Sustainability design-to-action network, where staff helped vet and support various projects tied to the yearlong designation. It was through this opportunity that they were connected to two regional organizations—Iniciativa Río Tijuana Asociación Civil (A.C.) and 4 Walls International—both with similar goals.
Tijuana-based Iniciativa Río Tijuana A.C. promoted the concept of the Tijuana River Index (TRI), an interactive platform to analyze the various issues facing the Tijuana River and identify potential areas for sustainable interventions. Similarly, San Diego-based nonprofit 4 Walls International was looking for a way to better understand project opportunities that could be prioritized for funding.
To facilitate the development of the TRI, Arup, 4 Walls International, World Design Capital, and Iniciativa Río Tijuana A.C. formed an alliance to leverage their collective expertise and address the persistent environmental and public health issues resulting from pollution in the river.
“Each organization in the alliance plays a unique and vital role in developing the TRI,” said Waylon Matson, cofounder of 4 Walls International. “Arup contributed engineering and technical expertise, 4 Walls International brought community-based design experience. World Design Capital supported the initiative through marketing and events. And Iniciativa Río Tijuana A.C. provided perspectives from those directly impacted by watershed conditions.”
Developing and Evaluating Priority Interventions
The team conducted a workshop with community members and nonprofit leaders from both sides of the United States-Mexico border and identified five priority interventions: waste cleanup, erosion reduction, revegetation and reforestation, access to green space, and decentralized wastewater treatment.
From there, the team used the Generate Tessellations tool in ArcGIS Pro to develop a hexagon grid that gives stakeholders a uniform way to examine the entire watershed and pinpoint where to implement these potential interventions. Hexagons were assigned an index score from zero to one for each of the five priority interventions, resulting in a total possible score of five for each hexagon. The higher the score, the higher the need for intervention in that area.
These scores were calculated using datasets processed with FME from Esri partner Safe Software in ArcGIS. The team used ArcGIS Pro to examine the data outputs and stage it before publishing it to ArcGIS Online. Then, they used ArcGIS Experience Builder to create the TRI app.
The app provides users with a seamless interface to view the TRI hexagon scores and their associated priority interventions for different areas of the watershed.

“Several supplementary datasets and a methodology page were included to provide clarity on how the index and scores were calculated,” said Gabriella Marquez, geospatial analyst at Arup and the TRI geospatial lead. “A data sources page was included to point the user towards more information on the underlying datasets, and all the data shown in the tool is also available to download.”
The team obtained authoritative datasets through Mexico’s National Institute of Statistics and Geography and the country’s National Water Commission. The San Diego Association of Governments and the California Open Data Portal also provided data for the project.
How Success Is Measured
The TRI hexagon scores help prioritize interventions in the five selected areas that critically impact water quality. The highest scores identify the highest-priority areas within the watershed where projects could be carried out. The designated interventions are currently in various stages of implementation.
This helps the team apply a stochastic, or randomly determined, hydro-financial modeling framework to the systems that are most critical to transboundary pollution.
“The framework combines environmental modeling with financial forecasting,” said Matson. “By modeling intervention outcomes and associated climatic uncertainties—such as wet years, dry years, and periods of economic uncertainty—the model helps predict potential outcomes under various conditions. This promotes more informed decision-making and allows stakeholders to quantify potential cost savings and performance outcomes.”
The model prioritizes upstream and downstream intervention strategies that are high impact and likely to succeed, aligning investor returns with environmental outcomes. This is an approach to conservation financing in which success is measured based on the outcomes of the interventions.
“Let’s say you plant vegetation on hillsides or reinforce a river channel upstream, which are both designated interventions. The model tells you how likely it is that those actions will reduce pollution downstream,” Matson explained.
That prediction is used to develop an Environmental Impact Bond (EIB) structure, where investors get a bonus if the project performs well based on monitoring data. If the project doesn’t meet its goals, investors may get less money back.
“The EIB provides a measurable return on investment,” said Matson. “This makes investors more comfortable taking part in environmental projects and helps communities invest in solutions that are more likely to succeed.”
Expanding Collaboration to Reveal New Opportunities
The team plans to further develop the capabilities of the TRI by including additional data collected by universities, nonprofit organizations, and others. This will depict a more accurate picture of the river’s evolving condition and uncover more opportunities for remediation.
The TRI also provides a location to host data that has historically been siloed—in some cases, on two sides of an international border. This will facilitate additional interventions and project development from organizations working the length of the river.
To learn more about or support the TRI, email Marquez at Gabriella.Marquez@arup.com or Matson at waylonmatson@4wallsintl.org.