Esri partners are breaking fresh ground with ArcGIS implementations that span countries, industries, purposes, and capabilities. From creating a city’s comprehensive master plan and instituting enterprise GIS at a critical port to building apps for a big event and making street-level imagery more accessible, the organizations that make up the Esri Partner Network do extraordinary things with location intelligence and advanced spatial analytics. Check out some recent projects to get just a taste of what working with Esri partners can ignite.
Advanced Spatial Analytics Reveals Redevelopment Opportunities in Michigan
Often dubbed Cereal City because it hosts Kellogg’s global headquarters, Battle Creek is a regional economic center in western Michigan that was looking for some direction in planning for future development and investment. Recently, the city partnered with Houseal Lavigne Associates to update its master plan, which incorporates spatial data heavily to help guide the area’s evolution.

First, Houseal Lavigne Associates used ArcGIS Business Analyst to assess the city’s demographic trends and market potential. The company then turned to ArcGIS Pro to spatially analyze existing conditions and create the master plan’s attractive maps and graphics. It produced more detailed blueprints for specific areas of Battle Creek as well. For Columbia Avenue, an aging auto-oriented corridor in Battle Creek, Houseal Lavigne Associates made a detailed corridor plan that recommends explicit actions to take to improve the area. It also employed Esri CityEngine to come up with a thorough redevelopment concept for the lakefront area near a key intersection of the community.
Battle Creek’s new master plan—which places strong emphasis on land use and development in a postrecession era—is a prime example of geodesign in practice, underlining how important map-based analysis and comprehensive graphics are to the future of planning. Using geospatial data more prominently than it ever has before, Battle Creek can now more easily identify its most pressing issues and determine the best solutions to them.
Shortly after Battle Creek adopted the new master plan, the city reengaged Houseal Lavigne Associates to develop an interactive model that would allow city leaders to visualize various ways the redevelopment plan could work based on the master plan’s recommendations. Using Esri CityEngine again, Houseal Lavigne Associates created a web scene that detailed the land use for various place types—e.g., downtown, commercial corridor, and residential neighborhood—outlined in the master plan. This gives the city a good idea of how it could change in the future.
The entire project, underlaid with GIS and spatial analytics, is fostering a holistic approach to planning and redevelopment in Battle Creek. The master plan takes into account the unique appearance and built character of distinct areas and examines how planning will affect different districts within the community. And the web scene is being put to good use. Currently, the city’s economic development agency, Battle Creek Unlimited, is employing it to promote the area’s full potential and market available properties to prospective buyers and business owners.
Port NOLA Enters a New Era with Enterprise GIS
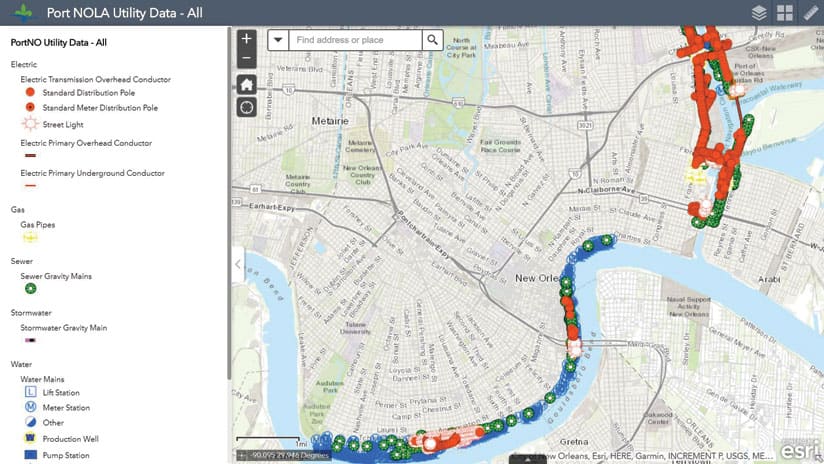
The Port of New Orleans (Port NOLA) in Louisiana is a modern multimodal gateway for global commerce and an in-demand cruise port that delivers seamless, integrated logistics solutions among river, rail, and road. As one of the United States’ most intermodal seaports, Port NOLA has been experiencing tremendous growth in the cargo and cruise industries, which has put additional demand on aging infrastructure.

In April 2017, the port embarked on a plan to implement enterprise GIS for its critical infrastructure. But it needed technical assistance with developing, integrating, and maintaining the technology. Port NOLA solicited proposals and chose Environmental Science Services, Inc.—known as Es2—to set up ArcGIS Enterprise, which Port NOLA is now using to support its mission to drive regional economic prosperity by maximizing the flow of international trade and commerce.
With enterprise GIS, Port NOLA can now analyze complex operational and land-use questions and make truly data-driven decisions—something that would not have been possible before implementing GIS. Previously disparate data sources are now combined and analyzed to identify gaps in the data.
“GIS is enabling more efficient management of critical infrastructure and analysis of key issues facing the port,” said Amelia Pellegrin, Port NOLA’s director of sustainable development.
One of the most pivotal components of this project was that Es2 deployed GIS in the field. The Esri partner used Collector for ArcGIS and Suvery123 for ArcGIS to develop configured apps that employees in the port’s maintenance and operations departments can use to increase their efficiency when conducting inspections, performing maintenance, and making repairs. Es2 also employed Web AppBuilder for ArcGIS to develop web-based apps that real estate management personnel now use to inventory all available Port NOLA properties. Not only does this help them manage the port’s current assets, but it also enables them to analyze properties that could potentially be acquired.
Enterprise GIS is already demonstrating its value for solving operational problems within the port’s existing footprint, and its potential for evaluating expansion opportunities is limitless. With ArcGIS Enterprise now in full use, Port NOLA has launched a new era of modernization and efficiency.
In New Zealand, Fieldays Gets a Comprehensive Site Plan and a Great Visitor Experience
Each June, the Mystery Creek Events Centre in Hamilton, New Zealand, hosts Fieldays, the largest agricultural event in the southern hemisphere. For three days, more than 130,000 visitors and roughly 1,000 exhibitors descend on the center to see demonstrations of the latest agricultural technology, participate in competitions, watch live shows, do some shopping, and indulge in chef tastings.

The event site covers 114 hectares (280 acres) of land and includes a network of permanent and temporary roads and buildings and a vast area for exhibitor sites, which are typically tented. To help with planning, setup, and event management, Mystery Creek needed an accurate site plan for the space. So a couple years ago, the center turned to GPS-it, which made the first truly spatial dataset of the site. It includes everything from imagery, contours, roads, and buildings to individual exhibitor sites, car parks, toilets, coffee carts, and first aid stations.
GPS-it then used Web AppBuilder for ArcGIS to develop a web app that Mystery Creek staff employ to plan the layout of the event site. The app allows staff to view proposed site plans overlaid on various imagery datasets that GPS-it collected both during previous events and when nothing was happening at the center. This helps Mystery Creek staff verify that the layout of the Fieldays site fits the permanent infrastructure, including roads; buildings; and underground services for telecommunications, power, and sewage.
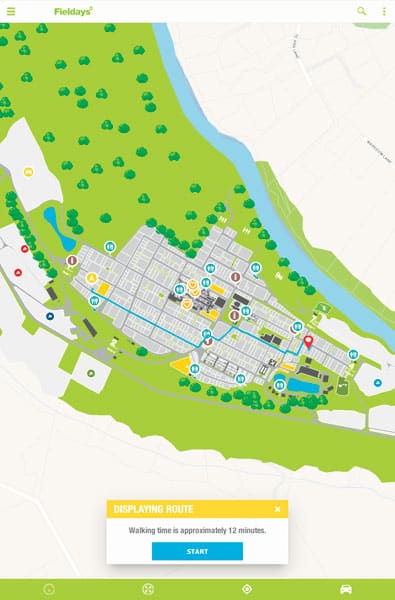
To celebrate the fiftieth anniversary of Fieldays in 2018, Mystery Creek commissioned GPS-it to create a new visitor app as well. The company used AppStudio for ArcGIS to build the mobile app and deliberately designed it to be very map-centric. Using ArcGIS Desktop, GPS-it’s GIS experts created a network dataset that enables users to easily navigate the event site. They can even calculate how to get to particular exhibitors, regardless of whether they’re indoors or outdoors.
The app was hugely successful. It was downloaded more than 34,000 times, elevating it to the second most downloaded app in the App Store in the New Zealand region during the event. Additionally, the mobile app captured more than three million location-based metrics, such as which exhibitors were designated as favorites by users, what routes were being calculated the most, and whose exhibitor listings got viewed most often. Both GPS-it and Mystery Creek staff are now analyzing these results to better understand visitor behaviors and needs.
GPS-it and Mystery Creek are continuing to employ the power of the ArcGIS platform to make Fieldays a great experience for staff, visitors, and exhibitors alike. Exciting upgrades are already under way for the upcoming 2019 event.
With Fresh Street-Level Data, the City of Johns Creek Saves Years of Work
The City of Johns Creek, Georgia, is somewhat of a tech role model for local governments. Since its founding in 2006, the city has prided itself on providing open data and smart solutions to its more than 76,000 residents.

With those goals at the forefront of its agenda, the Johns Creek GIS team set out in 2016 to find the freshest geospatial data available. This brought the city to Mapillary and its computer vision technology.
The GIS team was eager to build a comprehensive dataset of city assets, but manually capturing the location data would have been expensive and time-consuming. Now, Johns Creek can upload street-level imagery to the Mapillary platform—which includes ArcGIS integration—and automatically extract map data from each image using computer vision, a subset of artificial intelligence (AI) that involves the automated understanding of digital images.
To help gather all this data, Johns Creek actively encourages residents to get involved in mapping their community—especially since all they need is a smartphone plus the Mapillary mobile app, or an action camera along with one of the company’s other uploading options. Participating in Johns Creek’s #CompleteTheMap campaign, city workers and residents have mapped almost 350 miles of their city. The app geotags the images using the phone’s internal GPS and then uploads them directly to the Mapillary platform.
Mapillary’s computer vision technology then automatically extracts 1,500 different classes of street signs and their GPS locations from the images. Having a complete and up-to-date inventory of street signs is important, since they are key to road safety but require constant upkeep. As Johns Creek’s chief data officer Nick O’Day pointed out, using Mapillary saved the city years of painstaking work collecting street sign data manually.
“If we were to go out and try to capture all of these street sign locations across the city, we would have to carry a GPS unit and collect each point one by one, which would take a long time and cost a lot of money,” O’Day said.
Having up-to-date street-level imagery allows city workers to respond to issues faster than ever before. They can look at Mapillary images on their computers first, which often saves crews from having to go out into the field to investigate reports. The city is now usually able to fix issues in a single trip.
Johns Creek is also an early adopter of Mapillary’s map features, 42 additional object classes—such as fire hydrants, benches, and streetlights—that get automatically extracted from street-level imagery. They are available as shapefiles to use as feature layers in the ArcGIS platform.
Anyone can explore images of Johns Creek as well via the Johns Creek DataHub. The city built the open data site using ArcGIS for Developers, a complete mapping and location analytics platform for developers, along with the rich sources of mappable information in ArcGIS Online.
Working with Mapillary allows the City of Johns Creek to keep its geospatial records up-to-date while saving time and money and encouraging citizen engagement.

