The coronavirus disease 2019 (COVID-19) has affected nearly every aspect of life. As the virus spread rapidly, traditional supply chains and transit networks were disrupted. Investors faced uncertainty and stock markets plummeted, stalling commercial investment and economic growth. Governments around the world implemented sweeping stay-at-home orders—closing schools, government buildings, most retail establishments, and entertainment venues—to help slow the disease’s spread. Sporting events were canceled, restaurants and bars were shuttered or offered takeout and delivery only, and social distancing regulations were put in place to stop people from congregating.
In addition to these measures, local, regional, and federal governments, along with health-care and nonprofit organizations, needed to figure out where and how the virus was spreading. Location intelligence was—and remains—central to that. Esri technology empowered users all over the world to respond to COVID-19 and start planning for reopening and recovery.

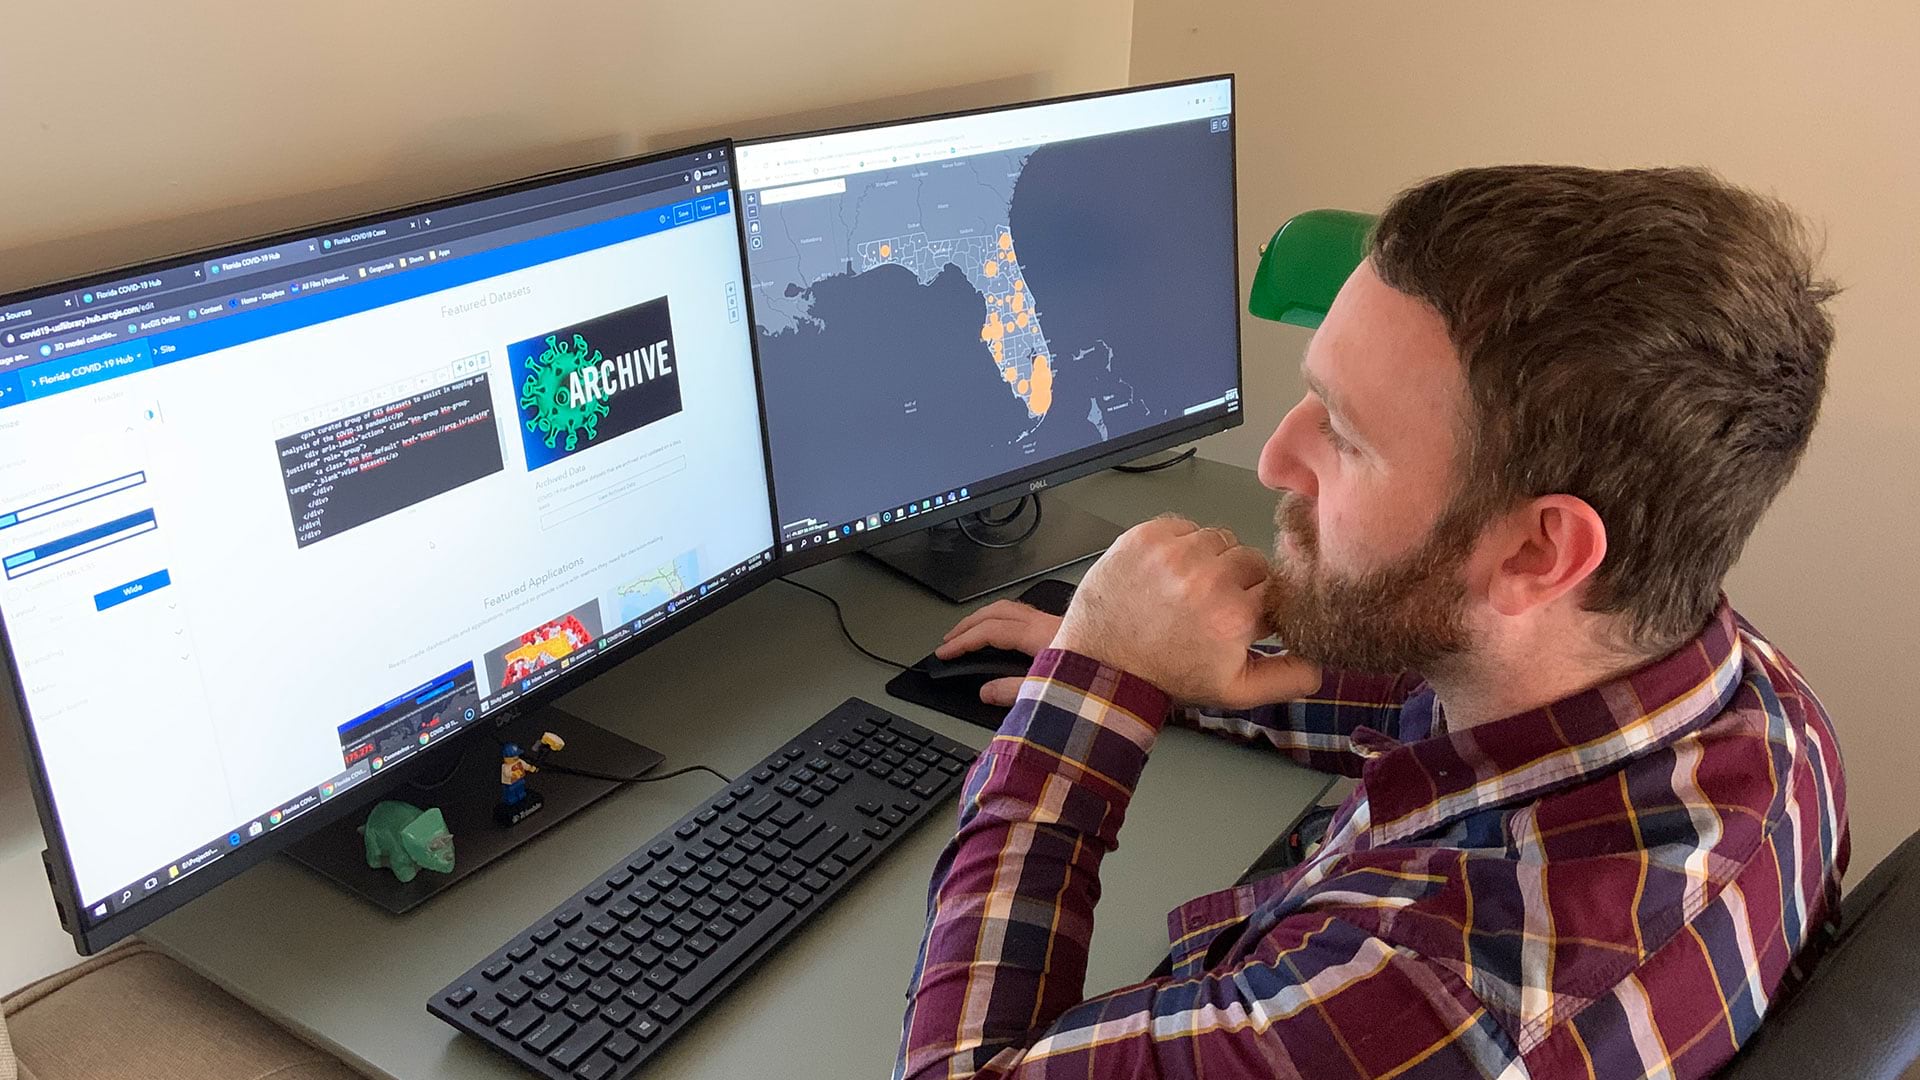
Esri spun up its Disaster Response Program (DRP) immediately to help users get access to critical technology fast. (See “A Disaster Like No Other” for more on this.) The company set up a microsite on its home page with links to resources for managing and responding to the crisis, maintaining business continuity, and reopening communities. The site includes dashboards, templates, apps, data, and even materials for at-home education. For more detailed GIS resources, Esri launched the frequently updated COVID-19 GIS Hub, which has a five-step guide for understanding the impacts of COVID-19, along with more specific apps, datasets, best practices, and GIS tools that users can incorporate into their own solutions. In addition, a global map gallery showcases maps and dashboards that organizations around the world have developed to tackle COVID-19. All these resources are designed to help organizations move forward with their response and recovery efforts and are intended to help them streamline plans.
But that’s not all. Esri distributors also helped users in their own countries and regions respond to this pandemic that has left virtually no place untouched. They have worked directly with national health ministries, nonprofit organizations, hospitals, and local municipalities to locate local cases of COVID-19, predict the disease’s spread, do contact tracing, and help people and businesses get back to work safely. It’s been a tremendous undertaking. And in many places, this focus on location—and on using GIS to gain a better understanding of COVID-19—is beginning to pay off.
Asia Pacific Countries React Fast
When COVID-19 first emerged in Wuhan, China, agencies throughout the region contacted Esri China (Beijing) to get help with applying location-based intelligence to their decision-making processes.
“Because of the urgency of the situation, we were tasked with developing a variety of systems in a very short period of time,” said Francis Ho, president of Esri China (Beijing). “This included epidemiological mapping, the development of big data platforms for the operation of various coronavirus prevention and control centers, and dashboards to visually display current COVID-19 data for decision-makers.”
Esri China (Beijing) supported the Shanghai Center for Disease Control and Prevention as it processed and analyzed spatial data to track the spread of the disease. It assisted one of its business partners in creating GIS-based epidemic surveillance command systems for both the Shanghai Center for Disease Control and Prevention and the Shanghai Municipal Health Commission. And in conjunction with the Chinese Center for Disease Control and Prevention, Esri China (Beijing) helped set up—in just four days—its New Coronavirus Infected Pneumonia Epidemic Distribution System.
“We did projects for both regional and national agencies that we continue to monitor and maintain,” said Sam Zhang, GIS analyst at Esri China (Beijing), summarizing many other endeavors the distributor undertook.
In the Hong Kong Special Administrative Region (HKSAR) of the People’s Republic of China, the government launched the Interactive Map Dashboard to monitor the status of COVID-19. Esri China (Hong Kong) provided technical support as part of a consortium that helped the Development Bureau and the Lands Department build and manage the dashboard.

“The sophisticated dashboard allows both the public and government agencies to easily view the current situation of COVID-19 in Hong Kong,” said Dr. Winnie Tang, founder and chairman of Esri China (Hong Kong).
The dashboard allows users to see a map of buildings that have had confirmed cases of COVID-19, along with pop-ups that show more details about the cases, such as the person’s age, when his or her symptoms started, and any buildings the person visited or resided in. The dashboard contains a time slider that shows how the disease has spread throughout Hong Kong, as well as a visualization of when cases have spiked and receded.
Farther south, Australia had just come out of one of its worst bushfire seasons in history when COVID-19 cases started surfacing there. Although emergency response agencies didn’t get much of a break, having to immediately roll into the next crisis wasn’t all bad.
“We were well oiled. We already had some pretty clear processes in place for how to deal with an emergency,” said Mark Wallace, public safety lead at Esri Australia. “We had some learnings from the bushfires, so as soon as we realized that COVID-19 was going to be a thing, we were able to be much more proactive as opposed to reactive.”
Esri Australia worked with users to make sure they knew about the DRP and helped customers ensure business continuity. In addition, the distributor worked closely with Emergency Management Spatial Information Network Australia (EMSINA), a nonprofit that, for 15 years, has brought together GIS managers from police, fire, ambulance, and disaster management agencies at all levels of government to improve emergency response by employing spatial information.

“We started to develop our Esri capabilities early on, when we saw that there was nothing coming out in a spatial sense for COVID-19,” said Kane Orr, secretary of EMSINA. “We had done a lot of work with Esri Australia throughout the Australian bushfires, and that’s where we started to see the capabilities of ArcGIS Hub—how it can aggregate a lot of different geospatial information in one area.”
For the pandemic, EMSINA collaborated with Esri Australia to build the COVID-19 Resources hub site, which takes data from the Australian government’s Department of Health and other authoritative sources to keep tabs on health-care resources across Australia. The hub site also shows the latest statistics on COVID-19 cases and deaths and links to other, related apps. What’s more, it’s a cross-jurisdictional hub that allows health officials to see how the situation is unfolding across the country as well as state by state.
“Both with the bushfires and this crisis, Esri Australia and other partners have been so helpful in getting agencies to do things that they normally don’t do: build new tools and figure out how to manage data in a different way,” said Naomi Withers, cochair of EMSINA. “It’s been fantastic, what we’ve been able to achieve, and some of the outcomes for the community have been so significant.”
Europe Monitors Virus and Prepares for Reopening
In Germany, which has been deemed a relative success story of the COVID-19 pandemic for keeping the number of cases and deaths quite low, a central approach to managing and sharing data about the virus has been key.
“Early on, we told the politicians that a dashboard was needed to keep every citizen in Germany informed about the crisis,” recalled Gerd Buziek, business relations executive for Esri Germany. “We set up a prototype dashboard and asked the minister of state for digital affairs to talk with us about providing an official dashboard for Germany.”

The minister, who is on German chancellor Angela Merkel’s staff, supported the idea, and soon decision-makers throughout Germany had access to the dashboard. This opened the door for Esri Germany to work with the Robert Koch Institute (RKI), the German federal agency and research institute charged with disease control and prevention, to develop a dashboard and hub site that track COVID-19 case data on a daily basis. The platform allows RKI scientists to see their data on maps while also keeping the public well-informed.
“We have gotten more than 73 million hits on the dashboard, and it has up to 2 million requests per day,” said Buziek. “We’ve had 125 million hits to the layers, meaning people are directly implementing them into their own dashboards and viewers.”
Command and control centers across Germany have incorporated this data into their dashboards and apps, which track the transport of masks and other medical equipment to facilities and manage logistics for helping regions that have high case numbers.
Several cities are also using the data from the hub along with authorized data from RKI to manage the crisis locally.
“Munich is using ArcGIS Workforce, ArcGIS Collector, ArcGIS Navigator, and ArcGIS Survey123 to distribute materials needed for hospital care and monitor vehicles that drive around making important announcements to citizens,” said Holger Ziehm, business development manager for safety and security at Esri Germany.
“As in every crisis, all the people and organizations helping out start from scratch. They have to come together and gather digital tools to do their work,” said Buziek. “What we did was set up the central platform—via ArcGIS Hub—to provide that crisis-relevant information, and then we connected the crisis management teams to it. They can then use that to make their own local decisions.”
In the United Kingdom, Esri UK quickly set up a response network to manage everything from software requests to customer engagement. In a whirlwind first few weeks, the distributor created new websites, pulled together webinars, and turned its technology research team into a COVID-19 support team. It also provided dashboards and other apps to help users track hospital bed and ventilator availability, maintain situational awareness, improve business continuity, and facilitate greater citizen engagement.
“We learned from Esri Spain about its GeoVolunteers program, so we implemented our own UK version,” said Miles Gabriel, commercial manager and DRP lead at Esri UK. Volunteers—who include users, nonusers, furloughed workers, and students—support Esri UK’s nonprofit customers, local authorities, and health care-oriented users in responding to COVID-19.
Turning toward recovery, Esri UK is working with organizations such as Sustrans, a charity that advocates walking and cycling, to help local authorities improve pedestrian access and upgrade bike paths.
“We’re creating a national dataset that shows which pavements and walkways are too narrow for social distancing,” Gabriel explained. “Local authorities can then use this to decide where to widen sidewalks, add cycling lanes, or implement alternate measures to encourage people to use these forms of transit as opposed to public transport.”
Esri UK is also aiding with ongoing research on COVID-19 by partnering with University College London on a 12-month project called VirusWatch that will investigate infections out in the community. The team is hoping that 25,000 participants will regularly report on whether they have COVID-19 symptoms, and on their social behaviors. Out of those participants, Esri UK is aiming to get 10,000 people to consent to being tracked using ArcGIS Tracker so the team can analyze their movement patterns across space and time to better understand how social distancing affects people’s risk of infection.
Emergency agencies in Portugal had to manage the COVID-19 pandemic while also preparing for fire season.
“Every fire station in Portugal now uses Survey123 to record the status of each firefighter,” said António Salazar, solution engineer at Esri Portugal. “We know, in real time, if firefighters are working, at home in quarantine, or at home because they are sick. We can also see, in real time, all the fire stations’ capacity to fight a fire.”

Esri Portugal has been working with the Ministry of Health’s Directorate-General for Health since the beginning on a dashboard that shows COVID-19 data on both the national level and a county-by-county basis. The distributor made two other dashboards as well—one that shows the evolution of the pandemic in Portugal and another that has county-level demographic information.
To help some of its users maintain business continuity throughout the crisis, Esri Portugal set up tools so they could monitor worker health.
“We had one client, a water utility, that could not stop its operations,” said Ana Marques, Esri Portugal’s marketing manager. “They used ArcGIS Dashboards to monitor which employees got sick so they could call in another person to do that work.”
The armed forces have benefited from using Esri technology, too. In addition to monitoring how many members of the military have been infected with and recovered from the virus, the armed forces have used GIS to keep track of their support of public health entities and schools.
“In preparing to reopen schools, the armed forces cleaned them with specific disinfectants,” said Rodrigo Gonçalves da Silva, sector lead for defense, security, and sea at Esri Portugal. “They have dashboards and surveys that tell them where the schools are and how many students and teachers they have. These tools help them keep up with their timeline for reopening schools.”
An Encompassing Response in Latin America
In Argentina, the federal government imposed strict lockdown measures when there were only 100 confirmed cases of COVID-19. Aeroterra, Esri’s official distributor for Argentina and Uruguay, was in lockstep with these developments, providing technology to monitor not only the virus but also its corresponding effects.

“What we did in the beginning was put together apps for understanding what was going on,” said Eduardo Viola, CEO of Aeroterra. “From understanding, action can be taken.”
The team at Aeroterra got in touch with a teaching hospital in Buenos Aires to help doctors and nurses provide care to people who likely had COVID-19 but weren’t sick enough to be admitted. To keep these patients in regular contact with the hospital’s health-care staff, they were asked to fill out a Survey123 form to report on their symptoms. Back at the hospital, doctors could monitor, on a dashboard, whether their patients’ symptoms changed and also get an overview of where and how cases were developing in the community.
Aeroterra worked with public safety agencies as well to develop apps and dashboards that helped them keep tabs on how well people were following stay-at-home orders. And once the country started reopening, Aeroterra began monitoring mobility trends.
“We put that data, which was already available, into comprehensive dashboards for each province to show how mobility increased or decreased,” said Viola.
Neighboring Brazil did not establish a strict lockdown, but the government did limit access to drugstores and shops. There, Esri’s official distributor, Imagem, worked with telecommunications companies and their anonymized cell phone data to create dashboards that showed how many people were staying home and how many were going out.
“These companies tracked, in general, where people were and presented that information to the government so decision-makers could define some actions to take,” said Felipe Barozzi Seabra, marketing manager for Imagem.

The distributor also worked with cities throughout Brazil to build dashboards that showed—sometimes down to the neighborhood level—the spread of the disease. Imagem made all these dashboards available on its COVID-19 hub.
“For Niterói, a city near Rio de Janeiro, they did some interesting analysis that shows case data in both 2D and 3D,” said Leticia da Cunha Mose Ferreira, Imagem’s marketing specialist for local and state government. “They can see the number of cases and some of the actions the mayor is taking, which shows how the city is responding. All the information is available in one story map, so citizens have everything they need in one link.”
Moving north, Esri’s official distributor in Costa Rica, Geotecnologías, worked extensively with government ministries to get a handle on the pandemic.
“We worked with the Costa Rican Social Security Fund, which is responsible for most of the country’s public health sector, to build some dashboards that helped them manage all the hospitals in Costa Rica. They needed to know how many cases there were, how many people were being treated for COVID-19, and how many people were getting tested,” said Edwin Solís, geospatial technology specialist at Geotecnologías. “They also asked us to create some epidemiological statistics so they could make important decisions about cases and how to organize the response.”
Geotecnologías also worked with the Foreign Ministry to build a dashboard that showed all the Costa Rican citizens stranded around the world so the government could help bring them back. And the distributor made an app and a dashboard for the Ministry of Economy, Industry, and Commerce to monitor which businesses were trying to overcharge for basic products, such as isopropyl alcohol and toilet paper.
“Ultimately, we are trying to help our customers and country see that, OK, we are having this crisis, but there are a lot of people working to prevent it from getting worse,” said Solís.
African Countries Use Targeted Technology
Several Esri distributors in Africa have been helping governments try to get a handle on COVID-19 infections as well.
The government in Rwanda is using a range of technology to implement a rapid, coordinated, and effective response to the pandemic, and it is relying on ArcGIS technology to better understand the spread of COVID-19, perform contact tracing, and predict where outbreaks might happen.

Esri Rwanda is working closely with the Rwanda Biomedical Centre (RBC), which manages the nation’s health-care services, to map confirmed cases of COVID-19 throughout the country and communicate this information to the public via interactive dashboards. The distributor is also supporting contact tracing by mapping populations that are likely to have been exposed to confirmed cases.
To do this, Esri Rwanda combines the data on confirmed cases with other local contextual data—such as where markets, restaurants, shops, and pharmacies are located, along with demographic and mobility data—to find out where people may need to undergo testing for COVID-19. From there, the government sends out a field team to conduct targeted interviews using Survey123, which feeds information back to a dashboard that then automatically selects sites for testing based on contact closeness indicators.
“We are using the most powerful location intelligence technology to geolocalize where there have been confirmed cases of COVID-19, and then we try to locate areas where those people could have met other people,” explained Jean Pierre Gatera, managing director of Esri Rwanda. “This helps the government carry out rapid and targeted interventions.”
In Ghana, key government officials—including the president, vice president, and cabinet members—have access to a COVID-19 dashboard that was built with support from Sambus Geospatial Limited, Esri’s official distributor there. Most of the decisions being made about the pandemic in Ghana are based on the information shown on the dashboard, which includes case counts, the number of recoveries and deaths, external data from Ghana Statistical Services, and an interactive map.
Moreover, the Africa Centres for Disease Control and Prevention, the public health agency for the African Union, embedded an ArcGIS Dashboards app on its website that shows all the latest COVID-19 cases collected from African Union member states. The site also has resources that include best health practices, scientific and public policy health updates, upcoming training events, and news and announcements.
It truly is a joint effort around the world to get a handle on the COVID-19 pandemic, and location data—fueled by Esri technology—is at the center of the crusade.