When data is presented in a language or format that people can’t understand or relate to, it essentially becomes invisible.
For too long, maps and data products have spoken primarily to experts, policymakers, and funders, often relying on academic language, technical symbology, or digital formats that exclude the very communities they aim to represent. This creates a disconnect—a breakdown in understanding, representation, and trust.
If someone can’t read a map’s labels, distinguish its colors, interpret its symbols, or see themselves reflected in the structure of the map, then the data fails. And when people can’t see themselves in the data, they can’t act on it. This isn’t just a usability issue—it’s a matter of equity, belonging, and empowerment.
This reality became clear to me when, as a nonprofit development director, I decided to use GIS to create a fundraising campaign based on a cognitive, data-driven appeal rather than one rooted in emotion. I collaborated with the Geospatial Centroid at Colorado State University to map health disparities, poverty, and social vulnerabilities across tribal lands. The project aimed to build a compelling, data-driven case for supporting tribal programs and policy initiatives.
The maps were originally designed for donors, but the communities themselves responded most strongly. Tribal members reached out asking for more maps, more data, and more ways to make sense of their experiences.
For many, it was the first time they saw their lived experiences plotted spatially. GIS didn’t just tell their story through the data—it helped them claim it. Data-driven maps became a language that their reality had never been spoken in before.
-
Mapping products should reflect the people they’re being made for and represent. Ensuring their availability in relevant languages is essential.
That feedback revealed something critical to me: data equity isn’t only about what’s mapped; it’s also about who gets to see, understand, and use the map.
This same challenge resurfaced in a new space when I began working in city government. As the GIS analyst for the City of New Braunfels, Texas, I found myself tucked between the culturally rich cities of Austin and San Antonio, where I encountered another gap in inclusion: language.
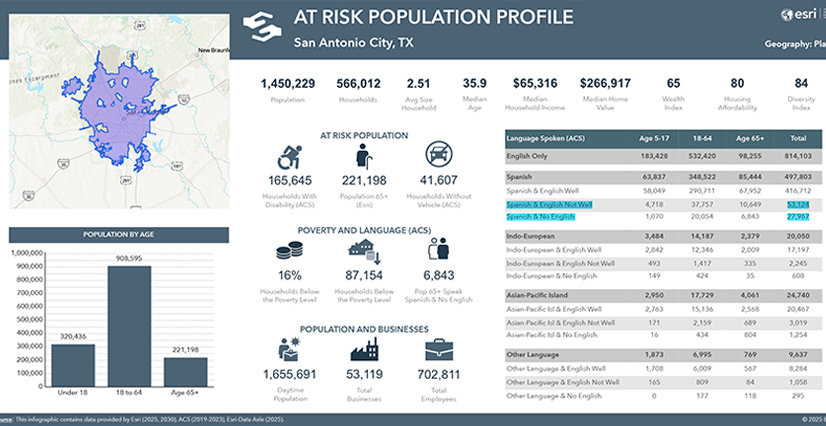
As I was using ArcGIS Business Analyst to generate an at-risk population profile infographic, it became clear to me that more than 27,000 residents in nearby San Antonio speak only Spanish and over 53,000 Spanish-speaking residents don’t speak English very well. In New Braunfels and across Central Texas, Mexican American heritage is a defining thread of many communities. Yet no out-of-the-box or dynamic solution existed to produce bilingual infographics. As a result, large portions of the population I served were left without equitable access to open data.
This was an inflection point for me. It reshaped the way I approach mapping. Now I see GIS as not only a tool for performing analysis but also a platform for fostering inclusion.
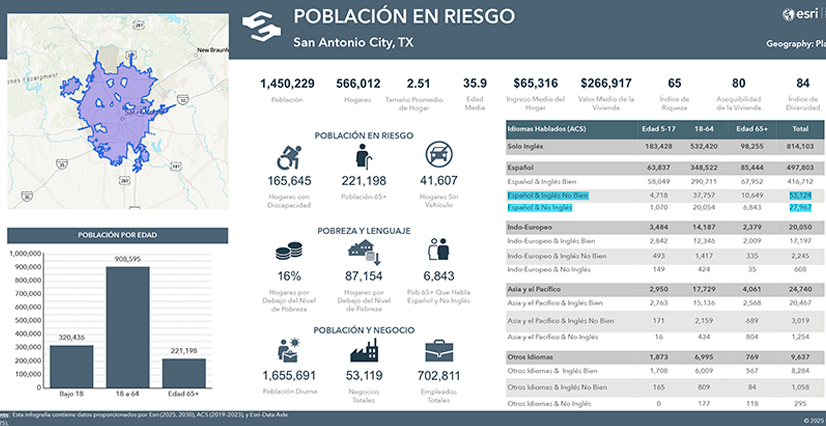
With the city’s support, I spent a couple months translating 23 public-facing English infographics into Spanish. As a bilingual speaker of both languages, I developed a translation key that ensured both consistency and cultural nuance. I then used a large language model (LLM) as a cross-checking tool to help refine phrasing and avoid word-for-word dictionary lookups. This approach combines human insight with emerging technology to move beyond literal translation. The result is a translation key and 23 templates for generating bilingual infographics that other cities can adopt. (Download the templates from the City of New Braunfels’ ArcGIS Hub site.)
This July, I brought the translated set of infographics to the Esri User Conference (Esri UC), where I connected with Esri’s distinguished Business Analyst and geoenrichment product engineer Helen Thompson. Together, we saw the potential to scale this work—not just for the City of New Braunfels but also for any bilingual community seeking access through language.
GIS professionals are uniquely positioned to advance equity by designing map products and data tools that are visually inclusive, linguistically accessible, and grounded in the voices of the people they represent. We’re already seeing what’s possible.
- A map called Jamaica’s 14 Parishes: A Tactile Map for Inclusive Access received the 2025 Universal Design and Accessibility award at the 2025 Esri UC. Author Jevaughn Henry created this map to be printed on swell paper for people with visual impairments to read through touch.
- An ArcGIS StoryMaps story called “Braceros Across the United States-Mexico Border” won the Digital Humanities and Popular Culture award in the 2024 ArcGIS StoryMaps Competition. It illustrates a participatory mapping effort by an organization called the Abuelas Project that invites descendants of Mexican bracero farmworkers to cocreate a multimedia narrative of migration, labor, and their own memories.
These projects remind us that equity in GIS doesn’t begin and end with good data—it lives in the choices we make when we design products for people to use.
Every map, dashboard, and infographic offers an opportunity to ask, How can I extend the limits of inclusion? To act on this question, GIS professionals should consider the following three design principles:
- Design for visibility. Think about who can see and understand your data.
- Use accessible color palettes, such as those that are colorblind-safe; legible fonts; and intuitive symbology.
- Ensure that products are compatible with screen readers.
- Include alternative formats like audio, braille-ready PDFs, or printable materials.
- Design for belonging. Consider who would feel reflected in the product you’re developing.
- Translate narratives, labels, and symbols into the language(s) your audience speaks.
- Incorporate place names, landmarks, and cultural references that are meaningful to local communities.
- Invite community members to contribute feedback on data, context, and design.
- Design for trust and action. Contemplate who has the power to use the data—and who does not.
- Prioritize clarity over complexity, especially when visualizing sensitive issues.
- Design for strengths, not just deficits or disparities.
- Share your methodology transparently to build credibility and support interpretation.
By consistently applying these three principles, GIS professionals can ensure that data not only informs but also includes, affirms, and empowers. Diversifying the lens through which data is viewed creates space for innovation that a single perspective alone could never unlock. What’s lost without translation is more than language—it’s the opportunity to build trust, spark civic engagement, innovate how data is collected and visualized, and reflect the lived experiences of the communities represented. What’s lost is the chance to widen the circle of inclusion.
This is a call to every GIS professional to democratize mapping not only through data accuracy but also through design choices that make mapping products visually inclusive, linguistically accessible, and grounded in the voices and realities of the people they represent.
