Spatial analysis employs location as a connective thread to help people understand where things are happening, how they are related, and where patterns exist. Putting various data types into geographic context helps people make decisions for today and predict the impacts of those decisions on tomorrow. For users of ArcGIS Online, it is now possible to leverage new feature and raster analysis tools in Map Viewer.

Map Viewer allows ArcGIS Online users to create, visualize, and analyze data. It is designed to be approachable and accessible, making it useful for a wide range of users—from novices to experts, and from those who work independently to people who are part of a large organization. With the right tools and techniques, GIS practitioners of any level and in any field can perform an array of spatial analysis operations, including taking simple measurements, completing complex geoprocessing tasks, and uncovering patterns and relationships in data.
The new spatial analysis tools in Map Viewer can benefit myriad ArcGIS Online users in their daily work. Read on to find out how.
The Differences Between Feature and Raster Analyses
The spatial analysis tools in Map Viewer can be split into two main categories: feature analysis tools and raster analysis tools. The latter is available to users who have the ArcGIS Image for ArcGIS Online user type extension.
Feature analysis focuses on vector data, which represents geographic features expressed as points, lines, and polygons. Doing feature analysis involves examining the spatial relationships among individual features, such as their location, size, shape, and attributes.
Raster analysis, on the other hand, centers on raster data, which represents geographic features as a grid of cells, and each cell has its own value. Performing raster analysis entails examining the spatial relationships between these cells, such as differences in their values and other patterns.
Choosing which kind of analysis to perform depends on the problem that needs to be solved and the type of data that’s available. Whether employing feature or raster data, Map Viewer enables users to analyze the data and visualize the results. Additionally, while each form of analysis is powerful on its own, integrating multiple tools in a single workflow in Map Viewer offers the greatest impact.
A Roundup of Key New Analysis Tools in Map Viewer
A broad array of spatial analysis tools is available in Map Viewer now, with more to come. Check out what a few of them do and get an idea of how to use them.
Generate Travel Areas
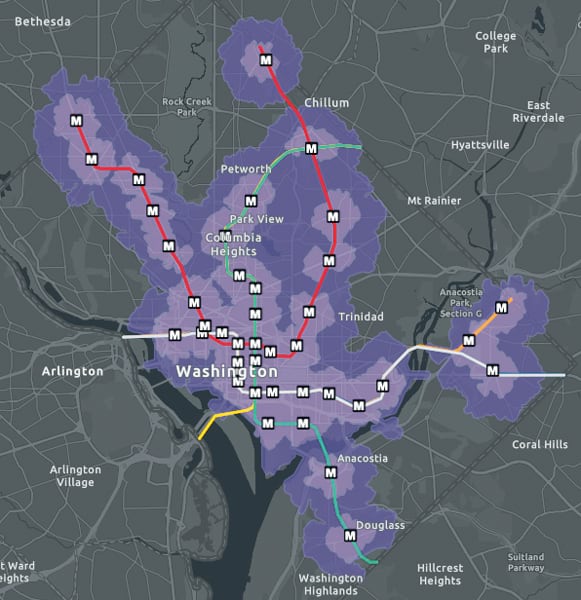
The Generate Travel Areas tool calculates the area that can be reached within a specified time or distance along a street network based on travel mode. Multiple travel modes are available, including walking, driving, and trucking. This tool employs street network data—such as one-way streets, speed limits, and other rules—to calculate the service, or reachable, area. Depending on the use case, the service area polygon can also include reachable streets, meaning the streets that can be traveled within the time or distance specified.
- How to use it: Transit planners frequently employ this analysis tool to determine things like where to build charging stations for electric vehicles and how to design public transit corridors and walkable cities. When looking at public transit in Washington, DC, for example, a walkshed analysis can show communities that are located within a half-mile and mile walk of metro stops.

Enrich Layer
The Enrich Layer tool makes thousands of data attributes for more than 170 countries available in Map Viewer. In addition to common census data, this tool has lifestyle, consumer habits, and spending data. The data can be added to any point, line, or polygon geometry to supplement analysis and visualization. Through the process of apportionment, the data is aggregated at the requested area, allowing for usage outside traditional geographies such as states, counties, and census tracts.
- How to use it: A store owner wishing to expand her business could use the Enrich Layer tool to examine the demographics of the areas surrounding her current, successful locations. By identifying patterns in these demographics, such as population age, disposable income, and consumer habits, she could find potential locations for new stores with similar demographics, indicating that these areas might contain additional target markets.
Find Hot Spots
Find Hot Spots is a powerful tool that identifies statistically significant clustering in the spatial pattern of data. Every dataset can exhibit some degree of potentially random spatial clustering. Performing a hot spot analysis identifies areas on a map where high or low values are located next to similarly high or low values. Analyzing the data in context with neighboring features helps determine where statistically significant clustering is occurring. This kind of analysis is important to do on datasets that might show clusters due to high population, such as crime or internet access datasets. Doing a hot spot analysis would help determine if crimes in an area are occurring at a higher-than-average rate or if fewer than the average number of households has access to the internet. This kind of analysis can also be performed to find higher- or lower-than-average costs of medical care, numbers of traffic accidents, and more.
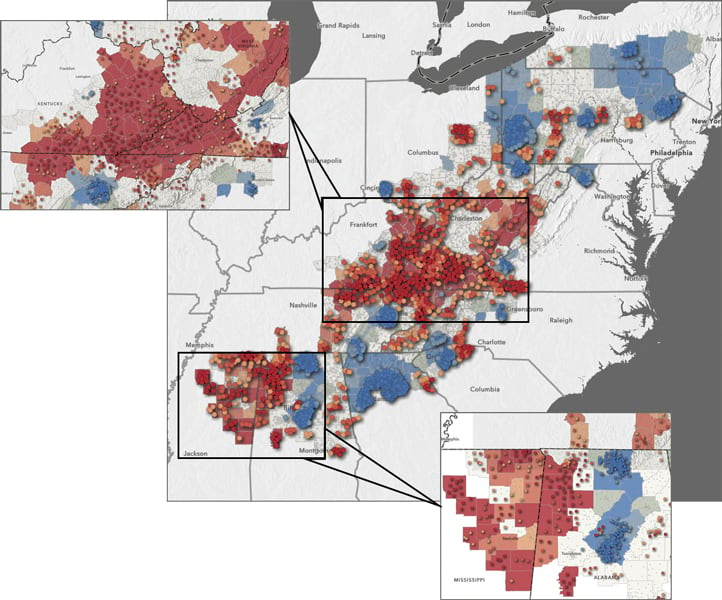
- How to use it: Over the past few years, it has become more important than ever to ensure that people have at-home access to the internet so that they can work, learn, utilize telehealth services, and more. The Appalachian region, which spans 13 eastern US states and encompasses large rural areas and economically disadvantaged populations, has historically faced challenges in building and maintaining infrastructure. The goal of performing a hot spot analysis in this case would be to determine if any regions within Appalachia lack decent internet access. Counties and census tracts with higher-than-average percentages of households without internet access can be represented by one color (red), while higher-than-average percentages of households with internet access can be shown in another color (blue).
Summarize Within
The Summarize Within tool calculates statistics where an input layer overlaps a boundary layer. Not only does the tool tally the number of times the layers overlap, but it also can calculate the statistics for any numerical attributes of the points, lines, or areas within the input layer. This tool is useful in cases where data needs to be analyzed inside a specific geography, such as a county or state, or binned into squares or hexagons.
- How to use it: A legislative analyst might be interested in summarizing the number of toxic release facilities within each congressional district. Or in cases where data privacy is a concern, such as in health care, an analyst might choose to summarize flu cases within hexagon bins, since they aggregate data outside typical geographies and don’t require attaching additional location information.

Detect Object with Deep Learning
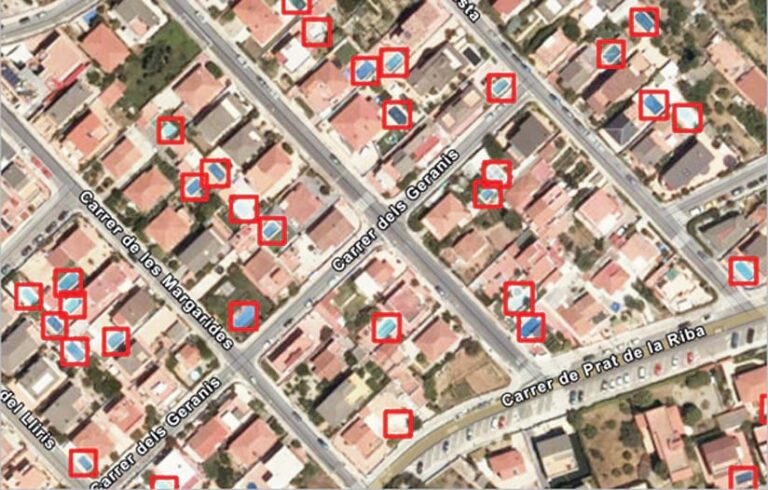
With ever more imagery available from a variety of sources, it is becoming increasingly important to automate and scale the creation of foundational GIS content, such as building footprints. For users who have the ArcGIS Image Online extension in Map Viewer, they have access to several raster analysis tools built around deep learning. One such tool is Detect Object with Deep Learning, which employs a deep learning model to locate and identify desired objects within an image.
- How to use it: For GIS analysts, digitizing features can be time-consuming. Using the Detect Object with Deep Learning tool, analysts automate the process of identifying features within an image, and the features’ locations get stored in a feature layer. Map Viewer also has specific deep learning tools to support different business needs, such as extracting building footprints for urban planning, classifying damaged infrastructure to expedite insurance processes, or creating impervious maps for taxation purposes.
Get Started with Spatial Analysis in Map Viewer
In addition to being able to leverage the new feature and raster analysis tools in Map Viewer, users can always take advantage of the ready-to-use layers and authoritative content available in ArcGIS Living Atlas of the World. Together, these and other features make ArcGIS Online and Map Viewer indispensable to anyone’s GIS arsenal.
To learn more about how to leverage Map Viewer in ArcGIS Online, explore in-depth use cases and tutorials. And find out more about the recent spatial analysis additions to Map Viewer.

