Communities don’t grow randomly. Land-use plans dictate how residential, downtown, and green spaces are designed and safeguard natural resources such as water, soil, and forests. They also prevent conflicts, like placing an industrial plant next to a quiet neighborhood, and support public infrastructure, including roads, transit, and utilities. In essence, a land-use plan foretells what an area will look like in the years and decades to come.
From municipality to municipality, however, land-use plans are largely disconnected. A city might not have easy, mapped-out access to the county’s plan, and adjacent towns could be in the dark about one another’s development objectives.
OpenPlanMap (OPM), the latest innovation from Esri’s Community Maps Program, aims to change that. The initiative encourages planners from all over the world to share their planning documents via an Esri-managed online portal. The data—originally presented in different schemas and languages—is then standardized and shared via ArcGIS Living Atlas, an open data site, and a new app, where it will help reveal the collective impacts of how communities are designed, both now and in the future. This cloud-based system for community sharing and integration of land-use plans will use a crowdsourcing process to create a consistent and continuous digital map that consolidates local and regional plans from around the world. Public and private land-use planners will share, upload, and update their plans over time.
Today, nearly every local and regional government around the world creates and maintains land-use plans in different digital formats. While these plans are typically shared publicly as open data and web maps, they have never been consistently brought together to form continuous land-use plan maps and datasets for regions, states, or whole nations.
For the last several years, the International Geodesign Consortium has worked closely with Esri’s ArcGIS Living Atlas team to create this system. This data will be maintained by Esri as a standard set of layers. It will also be available freely to anyone.
“The more communities that share their planning data, the faster it will start to mosaic,” said Ryan Perkl, Esri’s lead for geodesign and OPM. “Then we’ll be able to build this big, patchwork quilt of land use across the globe.”
This goes beyond simply cataloging what exists today—a common trait of land-cover mapping, according to Perkl. Instead, OPM aims to share what the land’s intended use is.
“A field in today’s land-cover map might not remain a field. The area’s land-use plan may show it becoming something else entirely—a neighborhood, a business center, or an industrial zone,” Perkl said. “Maps depicting land use show what changes may be on the horizon—a critical step in planning for the future.”
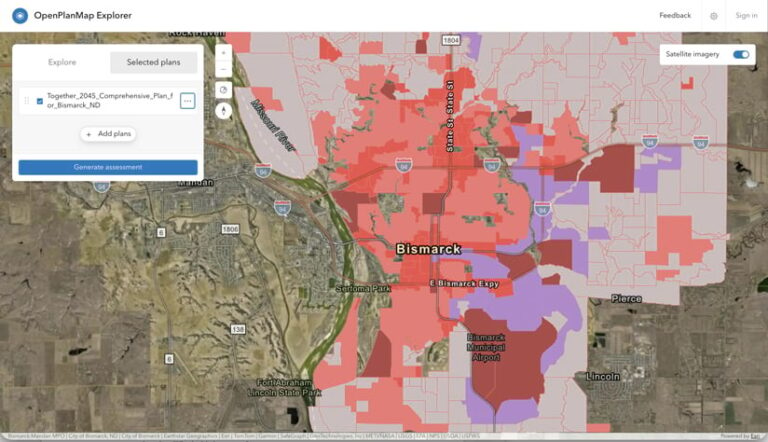
Planners who submit data to OPM also receive a map-based carbon assessment of their plan that reveals how much carbon dioxide it emits or sequesters. The hope is that their communities will use this to build accountability into their land-use plans and make adjustments that could have positive long-term effects.
But OPM’s multidisciplinary team has more ambitious goals. One is to eventually unite different types of data from various sources: transportation and open space plans from cities and counties, conservation plans from other government agencies, and land management plans from businesses and nongovernmental agencies. With this data, users could map and evaluate how to improve connectivity between places and develop resilient green infrastructure. This would make genuine progress toward cutting carbon emissions to levels that keep global temperature increases in check.
“The idea is that we can actually spatialize climate actions,” said Guoping Huang, an associate professor of spatial sciences at the University of Southern California, who helped develop one of the prototypes and serves as an advisory collaborator on the project. “That is the beauty of having a shared depository for all sorts of maps.”
Bringing Planning Data into the Light
OPM launched in July 2026, and its immediate goal is straightforward: Get planners from all over the world to submit their planning data.
“Some cities with advanced GIS departments might have published, map-ready planning data, but currently, a lot of it is confined to 300-page planning documents—PDFs—and it doesn’t see the light of day,” said Perkl.
In much of the planning community, it is customary to share plans publicly once they’re complete. But having the data all in one place, in a standardized format, opens an exciting new world.
Daniel Nairn, director of planning at the City of Bismarck, North Dakota, was not only open to submitting Bismarck’s planning data—he was also energized by having one place to share and discover data like this.
“We can always go online and fish around on a website to find others’ plans—we do that already . . . to make sure we’re staying in line and following industry standards,” he said. “But I think having one place with a standardized format will be helpful to draw those comparisons. If OPM grows to where we can actually see the region and how the cities and other communities that are directly adjacent to us are planning, it could become a regional planning tool.”
That’s what Tom Vo, the principal transportation planner at the Santa Barbara County Association of Governments (SBCAG) in California, hopes OPM becomes.
“OPM has the potential to support our data-driven and sustainable regional planning,” said Vo, who was involved in testing OPM.
He explained that the local jurisdictions SBCAG works with maintain their planning data using different formats and update schedules.
“OPM provides a framework that can help organize and standardize those datasets, making regional analysis more efficient,” he said. “By organizing planning information in a consistent format, OPM can improve our ability to understand regional growth patterns and evaluate how adopted local plans contribute to our regional transportation and sustainability objectives.”
AI Streamlines the Submission Process
Submitting data to OPM isn’t difficult, according to those who have done it.
“I uploaded Bismarck’s comprehensive plan as a large PDF document and then tied in the feature service for our future land-use plan,” said Darrel Nucech, a GIS developer for the City of Bismarck. “The portal actually had an AI assistant to interpret everything and then compile it all for us. So it wasn’t much effort on my end at all.”
To submit data to OPM, users must first register with the Esri Community Maps Program. There, the system allows organizations to upload their digital land-use plans. The system, which has been designed to accept multiple formats, automatically normalizes land-use plan classifications, different scales, and map projections before integrating the data into a continuous map layer and web map.
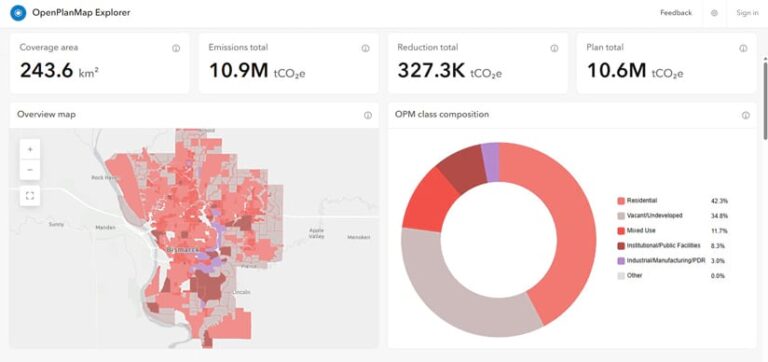
“We had more detail than what the OPM map layers incorporate—for example, we note ‘neighborhood mixed use’ areas, but OPM just groups that into ‘residential,’” said Nucech. “It just broke out that classification, and I reviewed it and said, ‘Yeah, that’s fine, that would be residential.’”
Submitted plans feed into a hands-off processing pipeline where an extract, transform, and load (ETL) system completes the remaining steps of the workflow. From there, three primary data products are produced:
- The original plan—The plan’s source data in its original format, projected into a common coordinate system for easier use.
- The OpenPlanMap plan—The transformed version of the plan, mapped in OPM’s land-use language.
- The global plan—A curated collection of qualifying plans appended into a single view of what’s happening around the world.
The data then appears in ArcGIS Living Atlas as authoritative data, on OPM’s open data site, and in the OpenPlanMap Explorer app. The app enables users to assess their plan’s performance and see what others are doing in neighboring communities or similar bioclimates. This is also where a plan’s carbon assessment report appears.
“Looking at carbon assessments is not something that’s typically part of a planning agency’s job,” noted Huang. “Now, it’s nicely generated on the web, as a map in ArcGIS Online, and will allow planners to understand the importance of their work and their shared responsibility for the future.”
Perkl hopes that OPM’s plan assessment can eventually expand beyond carbon emissions and include a myriad of other environmental, economic, and social metrics that are important to communities.
Mapping the Future, One Land-Use Plan at a Time
The technology is there. The challenge now is to get the planning community to submit their plans. This includes state, local, and tribal governments; regional planning organizations; universities and nonprofits; and anyone else tasked with planning for their communities.
“I’ve talked to some colleagues in Europe, and they’re planning to submit some data. I have also been talking to my colleagues in Asia who are working on a plan with a university, so maybe they will, too,” said Huang. “We want submissions from every municipality all over the world, where it’s possible . . . and I hope that, eventually, each city will have their own formal, spatialized climate action plan uploaded on OPM.”
As Huang pointed out, most of the GIS data we have is either about the past or the present.
“People are so concerned about the future right now, but we don’t really have a lot of data about it,” he said. “This is a way to enrich spatial data on the web so people are able to see a future.”