Inspiring What’s Next, the theme of this year’s Esri User Conference (Esri UC), urged attendees to consider not only what’s next in GIS technology but also to contemplate how they can use their expertise to address our world’s challenges at many scales.
At the Plenary Session, Esri president Jack Dangermond began by asking the audience to ponder what’s in store for the planet and, in turn, what that means for GIS professionals—specifically for their organizations, their communities, and their families. The planet is under pressure, he said, with increasing population, urbanization, climate change, and loss of biodiversity.
“The pace of change is accelerating rapidly…threatening our natural world and, some would say, threatening our future as human beings,” he told attendees of the Esri UC, which drew 18,000 people to San Diego, California, for a week in July.
From Dangermond’s perspective, all these issues require better understanding and a commitment by all of us to address these problems. GIS is central to this and to collaborating on solutions.
“It’s about applying the power of digital geography to create a better future,” Dangermond said. “This starts with envisioning what’s possible and then looking at all the things that you are actually doing and accelerating them—improving efficiency, making cities smarter, protecting biodiversity, and integrating environmental thinking into virtually everything we do.”
More than a dozen people took the stage at the Plenary Session to illustrate how their organizations use geospatial technology to design better cities, operate more efficiently and sustainably, protect precious ecosystems, and train tomorrow’s resource-conscious workforce. They are truly enriching what’s next.
Inspiring Collaborative Urban Design
Like many cities, Boston, Massachusetts, is experiencing a population boom accompanied by massive development.

“Population growth is occurring between our historic downtown Boston and [the neighborhood of] Dorchester at an average of 80 large development projects a year,” said Carolyn Bennett, the geospatial data manager for Boston Planning & Development Agency (BPDA). “Growth at this scale requires thoughtful planning.”
Which is what the BPDA does, helping Boston develop intelligently so it retains its renowned charm while heeding the future. To this end, the organization worked with Esri to design ArcGIS Urban, a new solution that streamlines urban planning and development workflows to keep planners, architects, developers, and citizens on the same page.
Esri account executive Brooks Patrick led the audience through a demonstration, revealing how ArcGIS Urban can affect—and has actually helped revise plans for—Boston’s ever-changing urban landscape.
“Zoning determines what you can build and what you can’t on a piece of property,” explained Patrick. “ArcGIS Urban can be calibrated to the local zoning code and can apply it in scenario planning.”
Zooming in to a proposed development on Boston’s Dorchester Avenue (or Dot Ave., in local parlance), Patrick first showed what the new development might look like if no changes were made to current zoning. He then altered parts of the zoning code and conceived of another plan with different building height and use requirements, balancing out a largely residential area with a bit more office space.
“We can immediately see how these changes would impact our view corridor down Dot Avenue, towards our historic downtown,” Patrick said. “In addition to measuring the amount of building construction, we can also estimate growth capacity for key indicators, such as total population, the number of households, and jobs.”
Patrick and Bennett then showed how ArcGIS Urban helped planners visualize a proposed building amid its surroundings—and even prompted developers to reduce its height, since it would have cast too hefty a shadow on the Boston Common and interfered with flight path restrictions around Boston Logan International Airport.
“We now have a standard process to evaluate projects and plans moving forward,” said Bennett about ArcGIS Urban. “This collaborative platform ensures a more economically prosperous, resilient, and vibrant city for generations.”
Inspiring Collaborative Government
Cobb County, Georgia, employs an extensive enterprise GIS to make its region more prosperous, resilient, and vibrant. Still, its information services department aspired to do more.
“We wanted to build on what we already had and make GIS easy enough and visible enough that anyone could use it to solve their problems—even a non-GIS professional,” said Sharon Stanley, director of information services for Cobb County.
Once staff got the attention of county executives—with a distillery tour, no less, built as an Esri story map—the use of GIS began to spread swiftly.
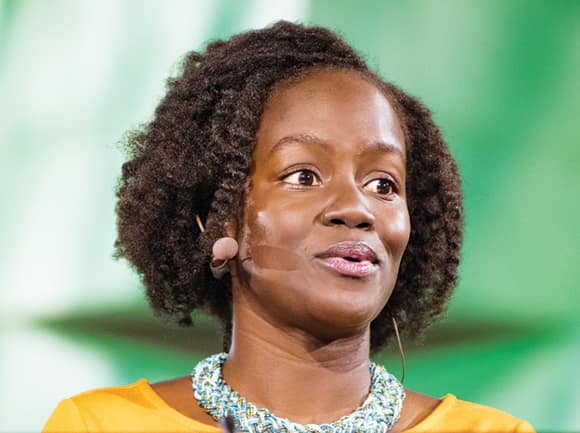
Felicia Alingu, the outcomes program specialist for Cobb Senior Services, had never used the technology before. But she took the Insights for ArcGIS training class offered by the GIS department and immediately recognized how it could be useful.
“Cobb Senior Services has five multipurpose senior centers, and it’s my job to help others understand our impact on Cobb’s older adults,” explained Alingu.
With Insights for ArcGIS, Alingu can easily communicate how valuable the centers and their programs are to the thousands of seniors who visit them each year. Dragging client data onto a map, she can see where the seniors live, which centers they go to and how often, and which activities are the most popular (bingo, of course).
“By 2030, one in three Cobb residents will be aged 55 or better, and the older adult population will be more diverse than ever,” she said. “Collaboration with the GIS department helps us find underrepresented groups so that we can work harder to engage all of the county’s older adults.”
Engaging Cobb County’s commuters is a big focus for Lynn Biggs, the GIS manager for the Department of Transportation (DOT). She showed the audience Cobb Commute, a GIS-based mobile app that provides users with road status information so they can see, in real time, whether any accidents or road construction projects will affect their travel.
The DOT also uses GIS to look for ways to improve roads. Reviewing three years of accident data for cars that hit large objects, such as utility poles, Biggs showed how the DOT used a geoprocessing tool to confirm that hills and curves are a major factor in these types of crashes.
“We can now actively look for roadway improvement projects to specifically address fixed-object crashes,” concluded Biggs.
Being proactive is one reason Cobb County built a digital twin of an area in its jurisdiction that is undergoing significant development: SunTrust Park—the new home of the Atlanta Braves baseball team—and its adjacent business center, the Battery Atlanta.
Working with an array of Esri partners to get lidar data and other imagery, Cobb County used ArcGIS Pro to construct the digital twin. Now, multiple divisions can use it to see, measure, and analyze details both inside and outside the 41,500-seat stadium.
The police department, for example, used the digital twin to come up with a comprehensive traffic management plan that gets all fans parked before the first pitch and returns traffic to normal flow within 45 minutes of a game ending.
“[It’s] a plan so detailed that the placement of every cone…is completely laid out,” said Lieutenant J.D. Lorens, the special events commander for the Cobb County Police Department.
At the end of each game, Lorens monitors the flow of pedestrians exiting the stadium by using a dashboard that shows maps, charts, and live security camera footage. With all this information readily available, he knows exactly when to change the traffic lights to red in a particular intersection to minimize pedestrian pileups and vehicle queues.
“We successfully manage traffic at the interchange between two of the busiest interstate corridors in the entire southeast,” said Lorens. “As a police officer, I never imagined that the platform our GIS professionals utilized would also make me and my team achieve a higher level of success.”
Inspiring Precision Forestry
One company using digital geography to achieve higher levels of sustainability is J.D. Irving, Limited (JDI). Headquartered in Canada, its operations include hydro energy, shipbuilding, agriculture, and retail, but its roots are in forestry.
The family-owned company manages 6 million acres in Canada and the United States, with a substantial portion of that land dedicated to producing forest products such as lumber, paper, and toilet tissue. To manage its land records efficiently, JDI started using GIS in 1984. Now the company employs the technology as a digital platform for business intelligence, using a hyperaccurate lidar scan of its forest to propel smarter decision-making.

“Over the last few years, we’ve been investing in precision forestry,” said chief forester Jason Killam. “For us, [this] means taking that lidar scan of the forest and transforming the inner workings of our supply chain processes”—tracing JDI’s merchandise from seedling to final product.
Using ArcGIS Pro, Killam showed in 3D how the company gains insight into the land and its health.
“We realized early on we needed a novel way to really organize this…big spatial data,” he said. “We did this using modeling, random forest algorithms, and the statistical package R to organize our data on 20-meter grid cells, all totaling 200 million grids.”
JDI has a precise inventory of its land that shows tree volume, the percentage of live crown on the trees, and even how deep the subsurface water table is. Now, the company can use location intelligence to automate how foresters make complex decisions, such as when to harvest certain trees and where. JDI can employ GIS to prioritize forest areas that need commercial thinning (removing any lands set aside for conservation) and can easily find the volumes of logs, stud wood, and pulpwood that are ready to harvest and deliver to the mills.
Heather Morrison, GIS lead for JDI, said that foresters can also take this data into the field on tablets using Explorer for ArcGIS.
“They are excited to have all our data at their fingertips—even in remote locations without cell coverage and…Wi-Fi,” she said.
This allows JDI to ground truth areas that are planned for commercial thinning, which helps trees continue to grow healthily.
“For instance, if I am in the field and see a bird’s nest that we want to protect, I can note it so the plan can be modified,” said Morrison.
Later this year, JDI will plant its 1 billionth tree. To commemorate that, Morrison and Killam presented a spruce seedling to Dangermond, who was impressed by how the company has embraced digital transformation.
“They are just an incredible company…integrating environmental thinking into everything [they] do,” he said.
Inspiring the Trillion Tree Campaign
While JDI is close to planting its billionth tree, the Plant-for-the-Planet Initiative, with support from the United Nations Environment Programme, has planted more than 15 billion trees worldwide. The organization recently launched the Trillion Tree Campaign, which aims to plant 1 trillion additional trees.
As part of that campaign, Plant-for-the-Planet acquired 55,598 acres on the Yucatán Peninsula in Mexico and hired 100 employees who plant about 6,000 trees per day. This tree planting program is supported by companies that want to be carbon neutral, said Felix Finkbeiner, founder and chairperson of the Plant-for-the-Planet initiative, who spoke at the Plenary Session.
The Yucatán project has been a resounding success largely because it follows best tree-planting practices and heeds the scientific advice of global system ecologist Tom Crowther, an assistant professor at ETH Zürich and head of the Crowther Lab there.
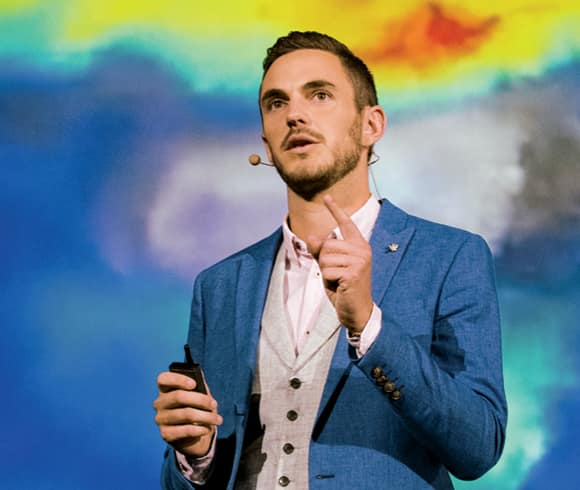
Crowther studies the science of where trees should be planted for restoration projects, as well as which species should be planted and in what types of soil. This is partly why Plant-for-the-Planet’s trees have a 94 percent survival rate after the first year, compared to 22 percent for similar projects.
Crowther’s research revolves around climate change and its impact on biodiversity, which includes the loss of trees and animals and the regulatory systems that manage the planet.
The best current plan to reduce global warming, according to Crowther, involves managing human emissions, since those account for 9 to 10 gigatons of carbon per year in industrialized parts of the world. But ecosystems like forests can help too.
“They’re the lungs that draw down carbon from the atmosphere, and they store it in the soil,” said Crowther.
Improving the carbon sequestration capacity of forests needs to be done carefully, however, because it can be damaging when trees are restored in the wrong ecosystem or planted in the wrong soil.
“When [the trees] fall and die, those soils get degraded, and nutrients are lost,” Crowther said.
To find out more about the ecological consequences of planting trees around the world, the Crowther Lab is mapping tree size, tree density, and the species identities of various forests. Crowther and his team are also cataloging the world’s soils to try to identify the ones that can best support new trees.
“If we manage these ecosystems effectively, there’s room for an additional 1.2 trillion trees,” said Crowther.
And that is where Finkbeiner’s Trillion Tree Campaign comes in. The two believe that having 1 trillion more trees on earth could capture up to 150 gigatons of carbon. So Finkbeiner, who is just 20 years old, is getting started—with a bit of help from Esri.
Onstage, Dangermond announced that Esri would contribute to planting 60,000 trees in the Trillion Tree Campaign, offsetting everyone’s travel to San Diego and making the 2018 Esri UC carbon neutral.
“Fantastic!” exclaimed Finkbeiner.
Inspiring a New Geospatial Workforce
Planning sustainable communities, running governments and businesses efficiently, and restoring forests all depend greatly on a well-trained workforce. Today, that means people who are knowledgeable about GIS, remote sensing, geodesign, and spatial computing.
The U-Spatial program at the University of Minnesota is a leader in training students, faculty, researchers, and staff in geospatial technologies.

“Nearly every discipline uses ArcGIS to enhance the three-pronged mission of higher education—teaching, research, and outreach,” said Len Kne, associate director of U-Spatial. “Each year, 1,000 [students at the University of Minnesota] are enrolled in ArcGIS courses. And more than 6,300 students, faculty, and staff have named user accounts in ArcGIS Online.”
Kne joined some U-Spatial students and faculty in demonstrating how geospatial technology gives them an edge. He first showed how the university uses enterprise GIS to “manage a city within a city”—conducting sidewalk inspections, for example, and giving that mapped information to campus facilities.
Students then demonstrated their own projects. Coleman Shepard, a master of geographic information science student, showed the audience how he employed Sentinel-2 imagery from ArcGIS Living Atlas of the World, along with ArcGIS Pro, Jupyter Notebook, and Python, to study clusters of earthquakes near the erupting Kilauea volcano in Hawaii.
“Observing these clusters over time, we are able to clearly see that…earthquakes near the caldera are continuing to increase,” Shepard said. “By extracting publicly available data on geodetic stations, I was able to measure the displacement of land over time.”
Using Jupyter Notebook, Shepard also calculated that the North Pit GPS station, which monitored data for the United States Geological Survey at the volcano’s rim, had dropped more than 65 feet.
“This is huge and is representative of the eventual collapse of the crater of Kilauea,” Shepard said.
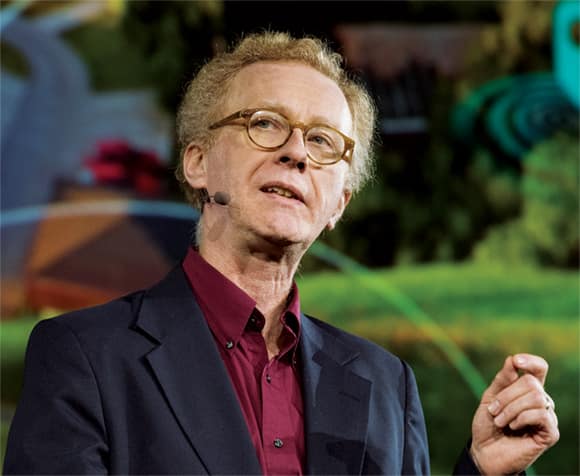
Professor Thomas Fisher, director of the university’s Minnesota Design Center, talked about how he sees these students as part of a new workforce that is increasingly nomadic and more of a sharing economy.
“Mobile devices, spatial tools, [and] digital apps are allowing us to live more lightly on the planet—to access what we need without having to own it and to pay for only what we use,” he said, citing companies such as Airbnb, Uber, and TaskRabbit as examples of this fast-growing economy.
Companies like those, Fisher said, are “squeezing out the inefficiencies of the twentieth century,” when too many goods were produced and too many resources were consumed. He anticipates that the sharing economy will free up land and resources to help people live more sustainably—but only if they are spatially informed.
“Spatial thinking is absolutely central to this new economy, helping us access goods and services and…identify underutilized assets that can be used to form community-sharing services that build local economies and expand the capacity of local governments,” Fisher said.
He then issued a call to action to the audience. “Every boardroom, every council chamber, every corner office,” he said, “needs the skills of spatial analysts and geodesigners to map the opportunities that exist and to make these unseen connections that will help our communities thrive.”

