The Downtown Detroit Partnership (DDP), a nonprofit that manages Detroit’s Business Improvement Zone and Downtown Detroit Parks, recently turned to 3D mapping to creatively market its metropolitan areas.
The once vibrant and bustling city of Detroit, Michigan, has gone through significant economic and demographic changes due to industrial restructuring. It is working to attract investment by business and lure back residents.
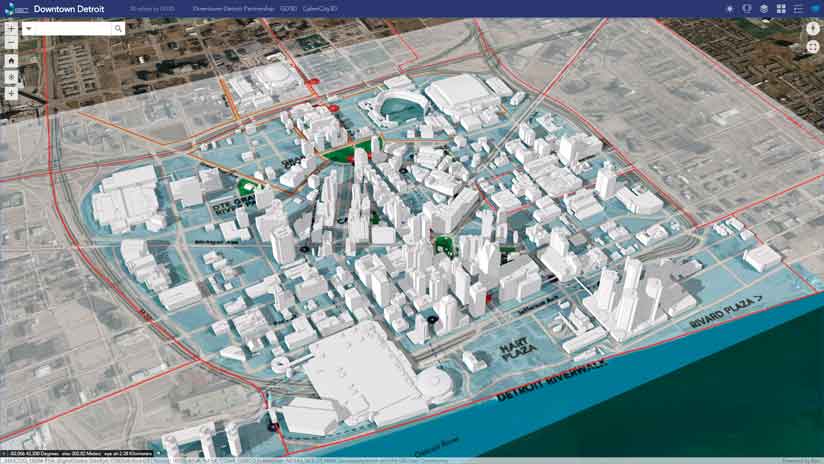
DDP engaged CyberCity 3D, Inc. (CC3D), to create a 3D map of its projects in the downtown area that would show projects that were recently completed, ones that are under construction, and those that are in the development pipeline.
CC3D is a Southern California-based company that creates detailed “smart” 3D city models. For this project, CC3D brought in Garsdale Design 3D (GD3D), its partner in the United Kingdom, to create customized 3D maps using Esri’s ArcGIS. Garsdale Design is a longtime Esri partner.
Rae DeVito, the communications director for CC3D, interviewed Joshua Long, DDP’s data program manager, about the 3D maps DDP unveiled in September 2018.
Rae DeVito: What was the project or application undertaken? What problem or issue did it address?
Joshua Long: The Downtown Detroit Partnership creates an annual report highlighting current and future building developments in our downtown. The report has been accompanied by a 2D story map in the past, highlighting locations of projects, together with information about each (expected completion, amount invested, land use, pictures, owner, and a narrative about the project from the developer).
This year, I’ve made it a priority to start visualizing our downtown business data in three dimensions to make our visualizations more powerful. After CyberCity 3D delivered the downtown models, CC3D’s Kevin DeVito arranged a meeting with Elliot Hartley at GD3D to discuss the possibilities in terms of online visualization of 3D data.
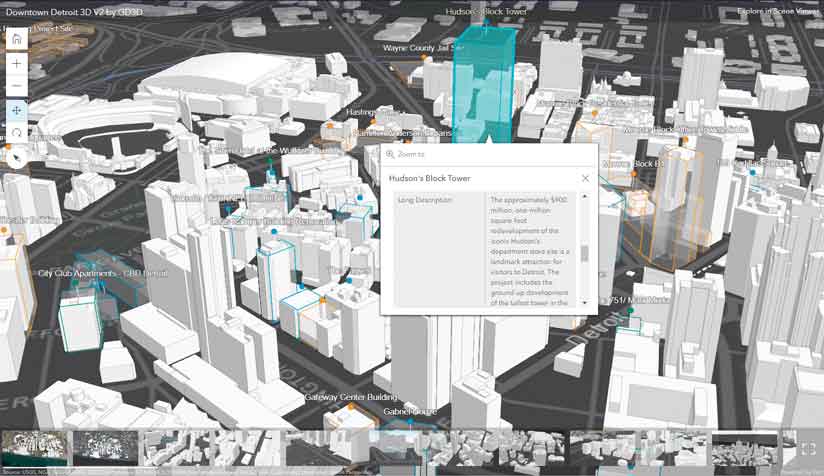
It became clear that creating the development update map online in 3D would be a great use of the new data. This application allows people to see how the skyline will be affected by new buildings. In addition, the format of the new tool (online and in 3D) really drives interest and entices more people to interact with the application and share it with colleagues.
RD: What aspects of the project or application are the most successful or unique?
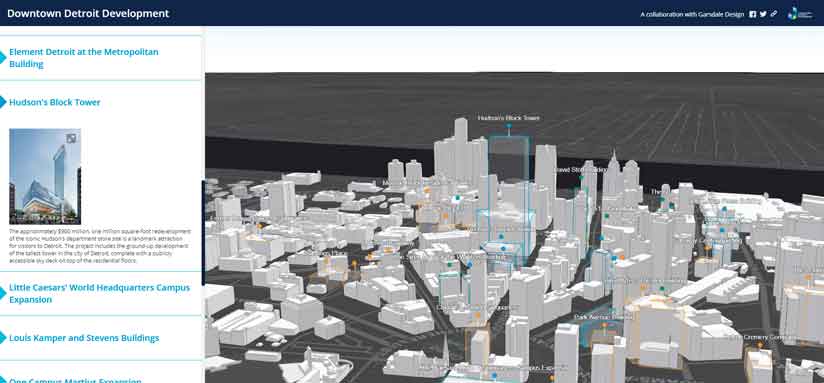
JL: While there are other groups in Detroit that are tracking real estate development, especially downtown, our annual update takes advantage of our relationships with developers by getting information about the projects straight from the source. This information includes a description of the project, history, goals, plans for tenants, and other information that others don’t get from news articles. Putting this information online, along with renderings of the projects, links to web pages, and general 3D massings of each project, makes this application really engrossing.
RD: How long did it take to complete, or is it ongoing?
JL: The data took several weeks of full-time work to put together, not to mention the time that CyberCity 3D spent creating the 3D models. Apart from the development of the data, the actual web scene and app development took around 40 hours over two weeks. Part of that time was spent getting up to speed with 3D GIS, 3D web scenes, etc. While I’m experienced using ArcGIS, ArcGIS Online, and ArcGIS Online apps, I have not done much with 3D. If I knew what I was doing, creating this application would have taken half the time.
RD: How was GIS integrated with other technologies in the organization?
JL: The first step for creating the Downtown Detroit Development Update report was to identify which new developments or major renovations were happening downtown. The DDP operates the Downtown Detroit Business Improvement Zone, and we regularly keep track of ownership since we collect an annual special assessment on commercial property.
Our first pass to identify new development was to list the properties that recently changed ownership. Our staff has working knowledge of development plans through our relationships, and that knowledge was also utilized to help flesh out our list of developments.
Finally, we cross-referenced with third-party sources, such as CoStar [a commercial real estate information company], newspapers, and online media. After we had our list, we created a survey using Google Forms and sent it to our developers to fill out (and hounded them for months). The spreadsheet generated from that was joined with GIS parcel information, which is kept in Salesforce to keep track of contacts and companies at each parcel.

RD: What is the future of the project or application?
JL: We plan on updating the app annually to coincide with our annual development update. In addition, we are encouraging frequent collaborators and partners to utilize the data and incorporate the web scene in their own applications. Further, we hope that the tool will entice future developers to share even more information about their developments because of the publicity that the application brings and the utility of seeing and sharing their project in the 3D landscape.
RD: Any interesting information about the city’s history and the issues it’s focusing on?
JL: Downtown Detroit is currently developing at a pace not seen for several generations. In our 1.1-square-mile downtown, the DDP development update listed 21 current developments and another 24 projects in the pipeline. These include new buildings as well as major renovations (most of which were complete gut renovations). Among current projects is the 912-foot Hudson’s Site tower, which will be the tallest building in Michigan. For a city like Detroit, which has faced many challenges over several decades and has worried more about population loss than development, the pace of change can be overwhelming. This application really helps to visualize just how drastically our downtown is changing and also draws attention to developers who are doing the work to transform our city. By making this application publicly available, we are hoping that our partners and the public can utilize the data and share insights about upcoming changes.
RD: What kind of reception is the map receiving?
JL: The application is averaging 240 views a day since inception. It had a huge spike in users right after the OpenStreetMap State of the Map US conference, held in Detroit in October. We did a social media push, [resulting in usage] peaking at nearly 2,300 views. It is incredibly useful that this application works well on mobile devices.