This tutorial walks you through the process of obtaining, managing, and mapping county-level data from a statewide spatial data site to generate a precision reference map. In this exercise, you will map data for Bolivar County, Mississippi.
One of the authors, Mike Price, offered to convert several exercises in a textbook written by the other author, Amelia A. Fox, from ArcMap to ArcGIS Pro. This supplied the impetus for this article. Fox, an assistant professor at Mississippi State University (MSU), developed a series of exercises applying GIS to precision agriculture that were compiled into Precision Agriculture GIS Technologies for Mississippi, First Edition. To learn more about her work and the program at MSU, read the article, “Mississippi State University’s Precision Agriculture Program,” in this issue of ArcUser.
Getting Started
Begin by downloading the dataset for this tutorial. Unzip the archive in a separate area of your computer dedicated to training, and preserve the folder structure. This archive contains a layer file that you will use to symbolize spatial data downloaded from the MARIS spatial data site.
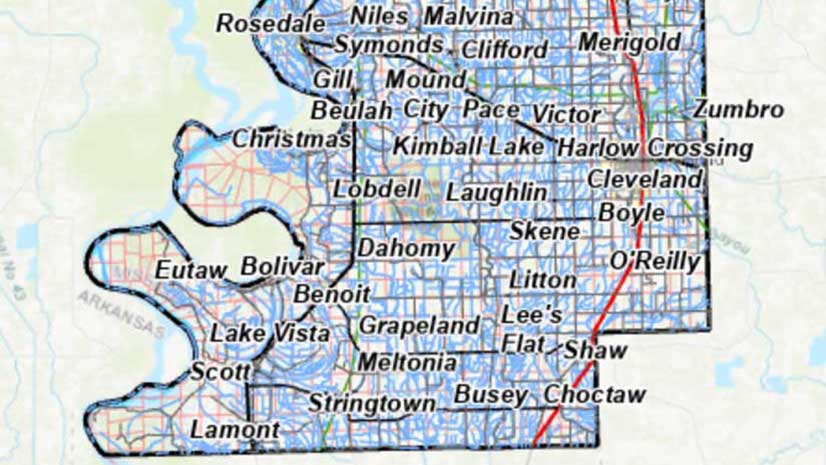
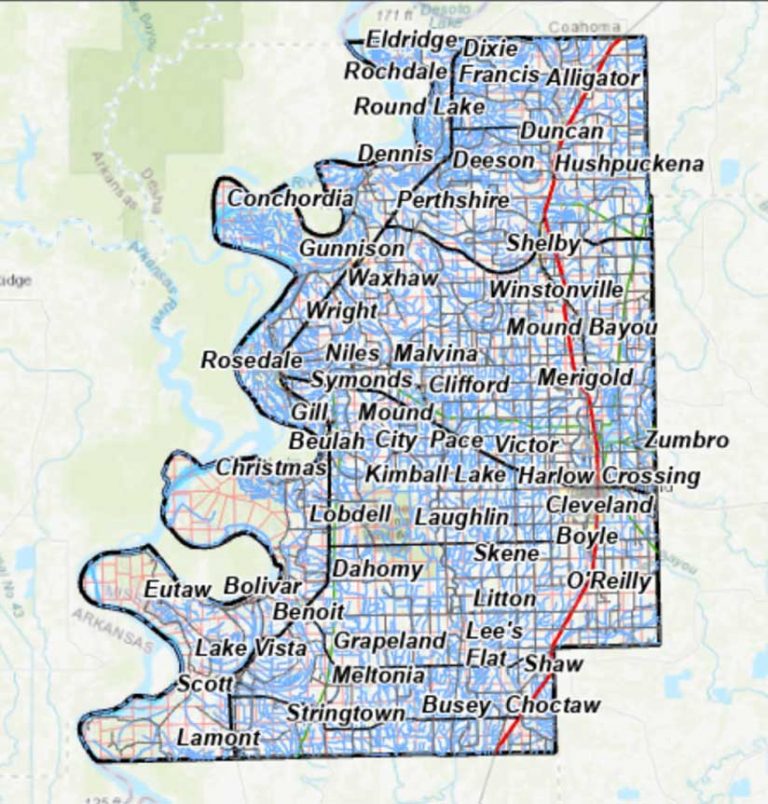
The goal of this exercise will be to create and populate a reference map to support agricultural mapping throughout Mississippi. Vector data for Bolivar County, which is located along the Mississippi River in the west central portion of the state, will be downloaded from Mississippi’s statewide geographic information system. You will learn how to manage, symbolize, and display vector data. Download and unzip the archive for the sample dataset.
- Start ArcGIS Pro.
- Click Map and create a new project named MS_Ag_Reference.
- Store the project in the MS_Ag_Technology folder created when you unzipped the sample dataset.
- When the map opens, the Topographic basemap is displayed by default. Zoom to center on the state of Mississippi. Set a preliminary proportional scale of 1:3,000,000.
Defining a Reference Coordinate System
Now, let’s enhance a statewide reference map. Since precision agriculture field data is often collected using GPS-equipped farm equipment or drones, reference coordinate systems, including modern horizontal and vertical datums, must be carefully considered. In the US, agricultural measurements are often collected and reported in Imperial units (e.g., feet, acres, bushels). However, metric units will be assigned to this reference map and ArcGIS Pro facilitates fast and accurate conversion between the systems.
At MSU, instructors often apply a universal transverse Mercator (UTM) projection and the World Geodetic System (WGS) 1984 datum, with base units in meters. The central meridian of UTM Zone 15N is -93 degrees, and the eastern edge of this zone is -90 degrees, so Zone 15N includes the western portion of Mississippi. Because the initial map includes the western third of the state, using Zone 15N makes sense. If mapping eastern Mississippi, it would likely be better to switch to Zone 16N.
In the contents pane, right-click Map and select Properties. In the Map Properties window, click the General tab, and name the map MS AG Reference Map—a short and concise name is good. Also, set the map and display units to meters.
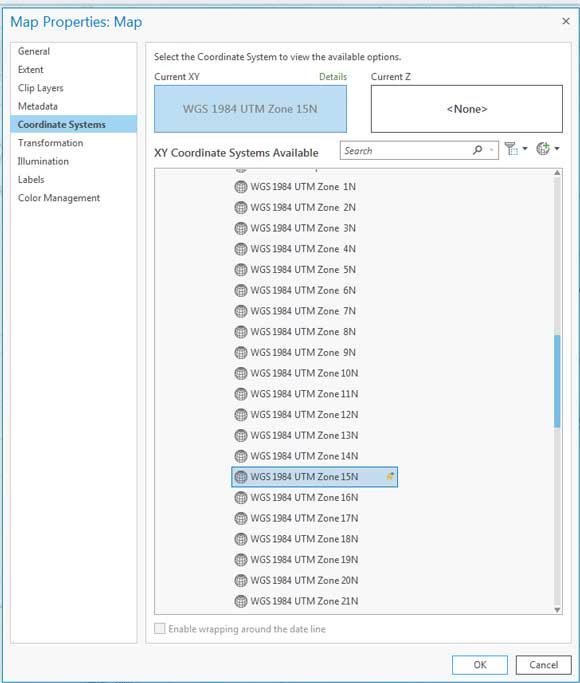
Next, click Coordinate Systems and notice that the current coordinate system is WGS 1984 Web Mercator Auxiliary Sphere, which was set by default because it is the coordinate system of the Topographic layer. To set the coordinate system to UTM Zone 15N, select the button under Current XY and expand the folders in the pane under XY Coordinate Systems Available.
Choose Projected coordinate system > UTM > WGS 1984 > Northern Hemisphere and select WGS 1984 UTM Zone 15N.
Although the North American Vertical Datum (NAVD) is scheduled for replacement in 2022, for this exercise, use NAVD 1988. [To learn about the adoption of the new datums in 2022, read “Moving from Static Spatial Reference Systems in 2022” in the Winter 2019 issue of ArcUser.] To set the vertical datum, select the button under Current Z and expand Vertical Coordinate System > North America and choose NAVD 1988. Click the Transformation tab, which can be used for adding data that uses a datum other than WGS 1984. Click OK and save the project.
After defining this projected coordinate system, let’s set a bookmark for Mississippi. Use the Navigate tool to pan and center on the state boundary. Type “2500000” in the Scale box, and watch the map reposition. Name the bookmark Mississippi 1:2,500,000 and type “State of Mississippi 1:2,500,000 UTM WGA 1984 Zone 15N Meters” as its description. This bookmark will work if you change the coordinate system to Zone 16N.
Don’t Skip Metadata
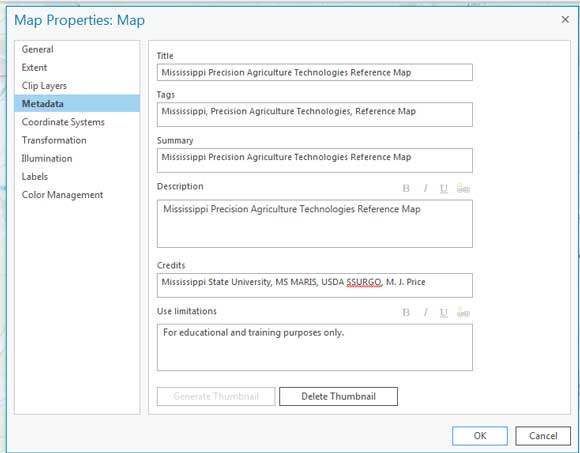
Let’s get serious about metadata for this map. Reopen Map Properties, click Metadata and type “Mississippi Precision Agriculture Technologies Reference Map” in the Title box, and copy and paste it into the boxes for Tags, Summary, and Description. In the Tags box, split the text with commas (i.e., Mississippi, Technologies, Reference Map). In the Credit box, type “Mississippi State University, MS MARIS, USDA SSURGO” and add your name. In the Use limitations box, type “For educational and training purposes only.” Click Generate Thumbnail.
Click OK to apply updates, save the project once more, and close ArcGIS Pro. Do this because the data that is downloaded in the next step will be stored in new folders. Reopening ArcGIS Pro will refresh the folder structures and show those new folders.
Adding simple metadata is not difficult and very important. For more information on this topic, read and work the companion exercise, “Create and Manage Metadata in ArcGIS Pro,” in this issue. This tutorial also uses MS MARIS data.
MARIS
Data for Bolivar County will be downloaded from the Mississippi Automated Resource Information System (MARIS) spatial data site. The MARIS Technical Center provides web access to Mississippi’s statewide GIS. MARIS data may be downloaded in shapefile or raster formats for personal and educational use. MARIS vector data is derived from US Census TIGER files, the National Hydrography Dataset (NHD), and other sources. This data is in Mississippi Transverse Mercator System (MSTM). Federal Geographic Data Committee (FGDC)-compliant metadata is generally provided for this data.
Locating and Downloading MARIS Data
The workflow for the MARIS data described in this exercise may be reapplied to any county in the state. Open a web browser and search for “maris mississippi gis data download.” This is an efficient search string that poses the classic questions of who, where, what, and why in a sequence that makes sense to any search engine. Apply the search to find the MARIS home page.
Click Download Data > County Data. The reference map will use vector data for Bolivar County, so locate and download the zipped dataset for Bolivar County. In Windows File Explorer, navigate to your training area and create a \MARIS data destination folder inside the \MS_AG_Technology folder. Extract the zipped Bolivar data into \MS_AG_Technology\MARIS. Minimize Windows File Explorer and the web browser. Restart ArcGIS Pro.

Transforming and Standardizing MARIS Data
Reopen the MS_Ag_Reference project and inspect the MS Ag Reference Map. In the Map ribbon, choose Add Data > Data. Navigate to \MS_Ag_Technology\MARIS\Bolivar, select all 11 shapefiles, and add them to the map. The map zooms to Bolivar County, located east of the Mississippi River. Verify that 11 shapefiles are loaded. Do not resymbolize these shapefiles, as a layer file will be used later.
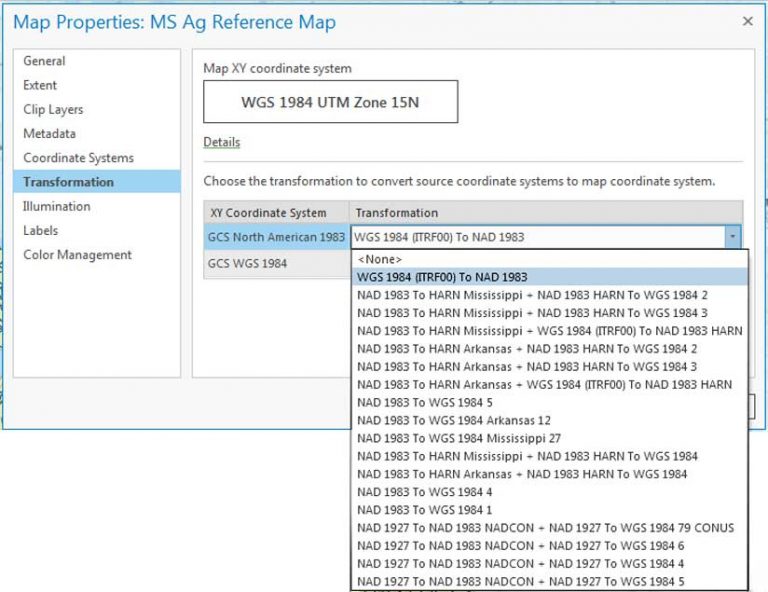
MARIS data has been projected in Mississippi Transverse Mercator System (MSTM) and North American Datum 1983 (NAD 1983). Since agriculture data is often collected by drones and portable GPS equipment, it must be properly transformed into WGS 1984. In Contents, open Properties for MS AG Reference Map and select Transformation. Because ArcGIS will be transforming across different datums, make sure ArcGIS Pro has set the WGS 1984 (ITRF00) to NAD 1983 transformation. If it has not been applied by default, select WGS 1984 (ITRF00) to NAD 1983 and apply it.
Inspect one of the Bolivar County MARIS shapefiles you just imported as a feature class. Right-click stowns_11 in the Contents pane and open Properties and click Source. Expand Data Source and Spatial Reference. The data type is shapefile feature class. The projected coordinate system is mstm, an abbreviation for Mississippi transverse Mercator. Review the other spatial reference parameters. Close the window.
Move down to NHDFlowlines16_11, open its properties, and look at its spatial reference. Unlike stowns_11, this shapefile’s projected coordinate system is NAD 1983 Mississippi TM. Careful inspection will reveal these are the same parameters—only the names are different. Unfortunately, this small difference may produce error messages when performing certain GIS tasks. Close the map properties and save the project.
Building a Precision Agriculture Reference Map
To create a new file geodatabase to store all MARIS data, open the Catalog pane on the View tab and right-click Databases > New File Geodatabase. Store the new geodatabase in \MS_Ag_Technology\MARIS\ and name it MARIS_Bolivar. The _Bolivar suffix protects the geodatabase from the separate MARIS folder and it will support layer file symbology for the county.
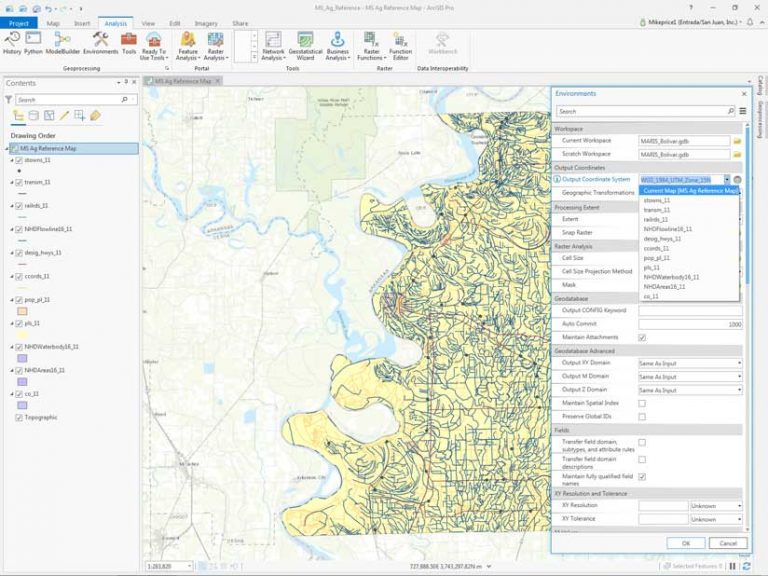
In the Analysis ribbon, open Environments to inspect Environments options. Set the Current and Scratch Workspace to MARIS_Bolivar.gdb. Set Output Coordinate System to Current Map (which is MS Ag Reference Map). Set Geographic Transformations to WGS_1984_(ITRF00)_To NAD_1983. Set Extent to Current Display Extent. Remember to update the extent if you decide to download and process a different MARIS county. Review, but do not change, the remaining Geoprocessing Environments. Close the Environments pane and save the project before continuing.
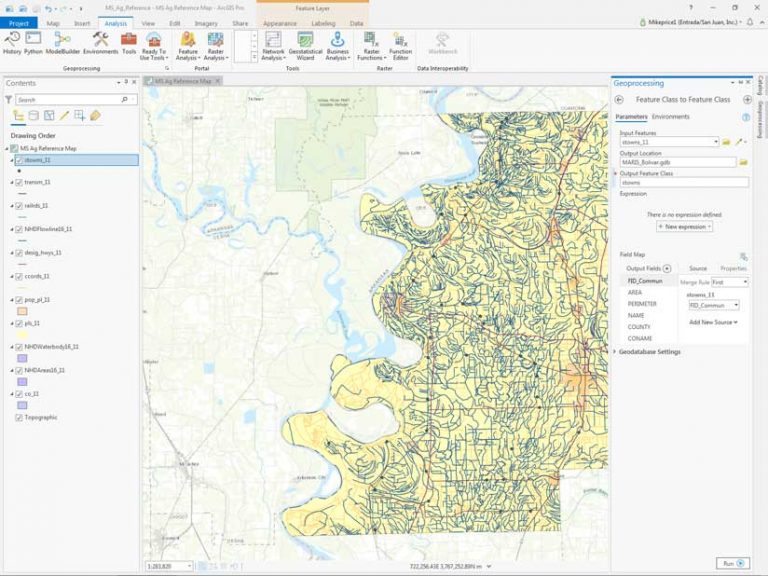
In the Contents pane, right-click stowns_11 and select Data > Export Features. On the Parameters tab of the Geoprocessing pane, Set Input Features to stowns_11 and the Output Location to MARIS_Bolivar.gdb, and name Output Feature Class stowns. Do not include _11 in this or any of the output file names. The _11 suffix is the county FIPS code for Bolivar County.
Still in the Geoprocessing pane, click the Environments tab and verify that the Output Coordinate System is WGS_1984_UTM_Zone_15N and Extent is set to As Specified Below. If not correct, fix this by choosing Projected coordinate system > UTM > WGS 1984 > Northern Hemisphere > WGS 1984 UTM Zone 15N so the correct transformation will be applied. Click Run and wait as ArcGIS Pro exports the shapefile to a geodatabase feature class. When completed, remove stowns_11 and stowns from the Contents pane.
Repeat this same process to export the other 10 Bolivar County shapefiles. Check the Output Coordinate System on the Environments tab to ensure it is set to WGS_1984_UTM_Zone_15N and the Extent is set to As Specified Below. Remember to exactly copy the source name, without its FIPS code (_11), as the name for each new feature class. Remove the shapefile and new feature class from the Contents pane after processing each shapefile.
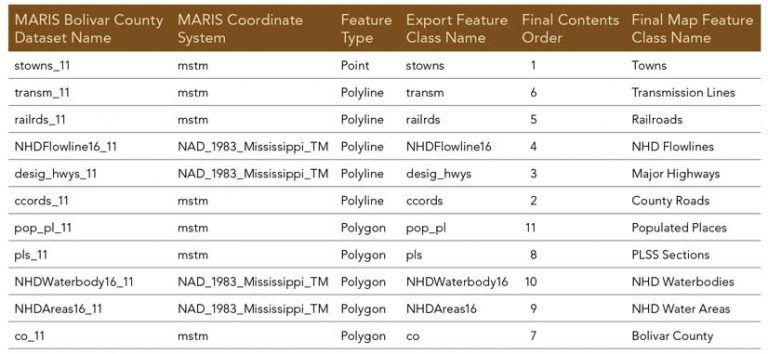
This is the most tedious portion of the exercise, so be patient and proceed carefully. Refer to Table 1 for information on file naming conventions or source coordinate systems.
Loading, Symbolizing, and Labeling MARIS Feature Classes
After exporting the last shapefile, co_11 to co, and deleting both layers, the map’s Contents pane will only contain the Topographic basemap. Do not save this project yet in case any exports failed. If any export fails, you can close the unsaved project, reopen it, fix any problems, and export again.
Now it’s time for the fun part—applying symbology. In the LYRFiles folder, a single layer file, MARIS ReferenceGroup, will reload all 11 grouped Bolivar County feature datasets in the order shown, with standard symbology and some labels. By pointing each feature class to its appropriate dataset, you can use this layer file to load MARIS data for any county. [Learn more about creating and using layer files in ArcGIS Pro.]
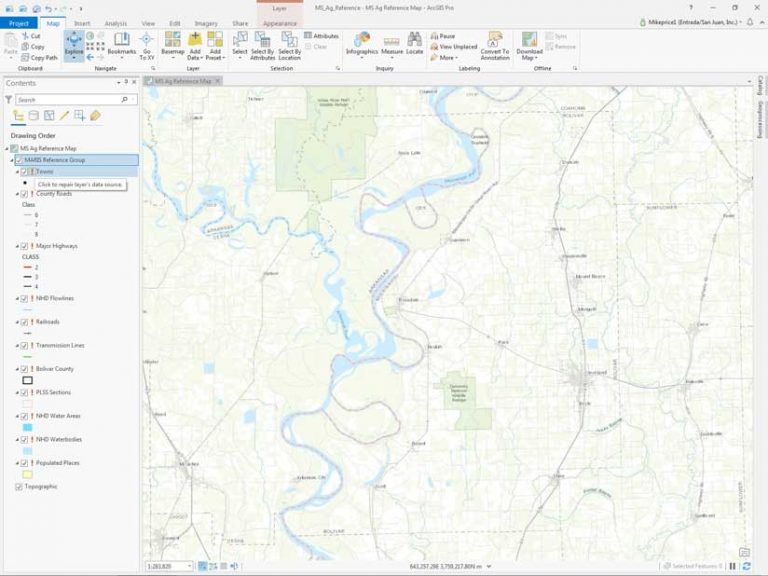
Open Add Data and navigate to \MS_Ag_Technology\LYRFiles. Add the MARIS Reference Group to Contents. Once loaded, note that all 11 feature layers have red exclamation points denoting broken data links. Instead of repairing each link individually, it is much easier to repair all 11 in one procedure. The Change Data Source tool in ArcGIS Pro can be used to update all 11 feature classes at once.
Left-click exactly on the exclamation point for the Towns layer, and the Change Data Source window opens. Navigate to \MS_Ag_Technology\MARIS, open the MARIS_Bolivar geodatabase, and locate stowns. Because this is the only point data in MARIS_Bolivar.gdb, it appears alone. So what about the other polylines and polygons? Select stowns, click OK, and watch the magic! All 11 map layers should link to their source feature classes if you carefully followed the naming conventions. If it all looks good, save the project.
If one or more of the layers did not find its source data and is not symbolized, use Catalog to verify its location and name. If necessary, use the Catalog View pane to rename layers so they adhere to the naming convention.
Bolivar County reference data is nearly complete, so let’s bookmark the county. In Contents, right-click Bolivar County and choose Zoom To Layer. Adjust the scale to a round number. In the Map ribbon, choose Bookmarks > New Bookmark. Name the bookmark Bolivar County, Mississippi with the scale, and type a description for it.
Let’s perform some housekeeping chores. Right-click MARIS Reference Group, open Properties, and change Name to MARIS Bolivar County Group. Switch to Metadata, and populate metadata fields in the same way you did when creating the map. Make sure to create a thumbnail. Save the project one more time.
On Your Own
You have created a precision reference map for Mississippi that is designed to obtain, manage, and map county-level data from a state data provider. In this exercise, you mapped data for Bolivar County. On your own, select another county and repeat the process.
Remember to create a new county geodatabase, change the Geoprocessing Environment Current and Scratch directories, and update the processing extent to match the county you chose. If you pick a county that lies east of -90 degrees longitude, update the Output Coordinate System to WGS 1984 UTM Zone 16N.
Follow standard naming conventions previously described so you can use the MARIS Reference Group Layer file to symbolize the county you chose. Finally, don’t overlook metadata. When you see a Metadata tab in any pane, open it, and update as necessary.
The companion exercise, “Create and Manage Metadata in ArcGIS Pro,” in this issue uses MARIS data for Warren County. You can use the data from that tutorial to try this tutorial’s procedures on your own. If you like fluvial geomorphology, you will appreciate the very interesting landforms of the Mississippi River.
Summary and Acknowledgments
This exercise uses data from MARIS and replicates the workflow developed by one of the authors (Fox) and the staff at MSU’s Precision Agriculture Program. Read more about the Precision Agriculture Program in “Mississippi State University’s Precision Agriculture Program” in this issue. That workflow appears in Fox’s book, Precision Agriculture GIS Technologies for Mississippi. The authors thank MSU for data access and the opportunity to re-create one of the precision agriculture tutorials in ArcGIS Pro.