A capital improvement plan (CIP) is an important tool for organizations such as water districts and local governments when planning, managing, and coordinating the expenditure of capital funds. CIPs help maximize the return on investment (ROI) over an asset’s life cycle. This article describes a solution that enabled a water district to more effectively manage its water mains by moving its CIP from a static report to an app.
The Dedham-Westwood Water District in southeastern Massachusetts is a private water supplier that provides water to two neighboring towns, Dedham and Westwood. The district manages 208 miles of water main serving more than 14,000 customers. Staying ahead of repair and maintenance is a constant challenge. Balancing budgets and schedules can become daunting.
To assist in prioritizing improvement and justifying capital expenditures, the district partners with Weston & Sampson, a company that provides interdisciplinary design, engineering, and environmental services for public and private entities, to produce and regularly update the district’s CIP. This CIP is developed in three general stages—assembling data, evaluating conditions, and ranking assets—to produce a priority list of assets (PLA) that then help prioritize expenditures and maximize asset life cycle and ROI.
The CIP assesses a variety of asset variables that range from the condition and history of water mains to the paving schedule for Dedham and Westwood. The CIP is projected across multiple project time frames. Projects for the most important asset replacements are scheduled in the first year, with projects of less importance scheduled later. Projects can span 3 to 20 years.
Traditionally, the CIP takes the form of a static report. This means that if conditions change significantly, the plan’s recommendations may not reflect its original intent. Also, assembling and evaluating all this data can take considerable time and is dependent on the condition and availability of resources. For example, a CIP that relies on the attributes within GIS will need to ensure that these attributes are fully and accurately populated. Because good data is required for good recommendations, significant effort is spent ensuring data quality. The process sometimes consumes 50 percent or more of the time spent on data assembly.
For these reasons, Weston & Sampson sought to provide a responsive solution that would proactively assemble as much of this data and categorization as possible and produce an up-to-date PLA so that the discussion of annual CIP efforts could start immediately. This solution is the CIP Viewer and PLA generator.
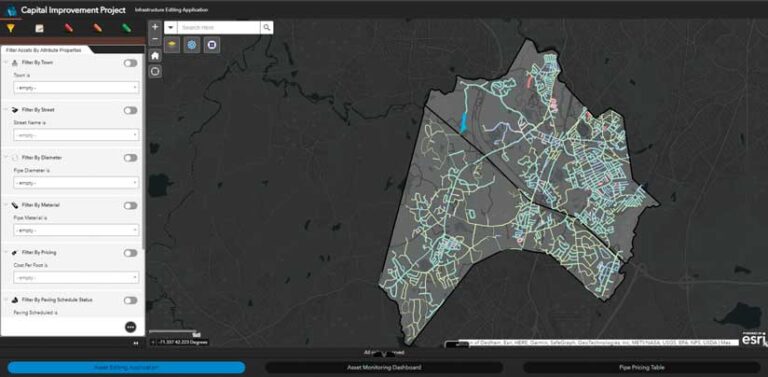
After migrating the district’s data to ArcGIS Online, Weston & Sampson helped establish its CIP in the platform. Weston & Sampson took advantage of the configurable nature of ArcGIS Online platform components by embedding separate ArcGIS Web AppBuilder and ArcGIS Dashboards applications within an ArcGIS Experience Builder wrapper to produce an application that responds to dynamically changing inputs. These might be attributes of the water main feature service in ArcGIS Online (e.g., age or material) or an associated feature service (e.g., main breaks) or direct user input such as paving schedules or costs.
Two centerpiece elements of the solution were the ability to integrate with the district’s third-party asset management and work order software, and the primary algorithm used to facilitate the assembly and ranking of assets. The open-source REST end point architecture of services in ArcGIS Online lent itself to a seamless integration with the district’s existing software.
Weston & Sampson worked with the district’s existing software and established electronic forms in this platform that connected with and stored data in an ArcGIS Online hosted feature service. This made the history of breaks seamlessly available to the primary algorithm.
The primary algorithm for the development of the PLA is a customized script included in a scheduled ArcGIS Notebooks task on ArcGIS Online. The script periodically examines the input variables that are preserved as feature attributes and calculates priorities for each asset across the entire system based on a normalized score that is designed to be consistent with the approach developed as part of the original CIP.
Assets are assessed based on their proximity to other assets, allowing them to be reprioritized based on the scores of those other assets and increasing the potential efficiency of any recommendations that result from prioritization.
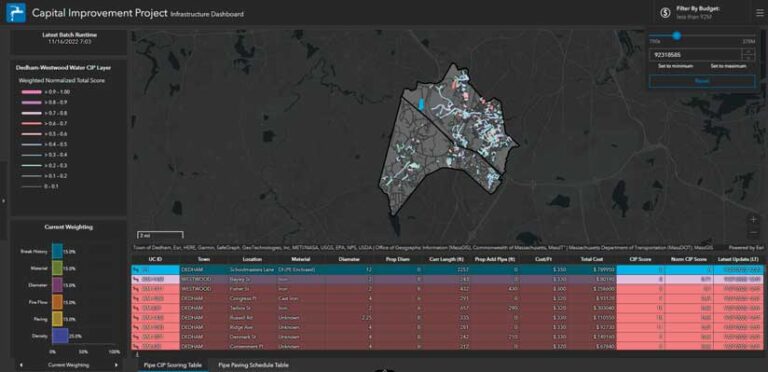
This allows the prioritization to be modified based on the condition of nearby assets and inserts a large measure of efficiency to a proposed list of assets. A summary dashboard portion of the application allows users a look at the prioritized list of assets and offers a set of filters to review conditions, including a budget filter that will take as input a budget number and display in an interactive map and table the list of assets of highest priority.
Weston & Sampson wanted to give district staff—and whoever is going to design the next CIP—a measure of control over the algorithm to affect how it was applied to each of the assets so that a custom fit could be developed for unique scenarios. The application is meant to facilitate quick assembly and ranking so that projects and allocation of funds/resources can proceed more readily.

The solution includes the ability to manipulate inputs globally or at the level of individual assets, allowing for tailored cost estimates. For example, a default cost per foot for the replacement of a given diameter of pipe can be assigned, but that cost can be overridden on individual assets if conditions such as additional permitting, difficult excavations, or response to an unanticipated quote or change order exist. In addition, weights (also manipulable at the asset level) can be applied to individual variables that will redistribute priorities based on whichever factors the district chooses to accentuate.
If the system needs to be expanded to accommodate new developments or subdivisions or establish looping scenarios for water quality concerns, users can establish new assets, such as pipes within the application that can be considered in a CIP. The algorithm establishes a separate set of asset pipes for evaluation without managing temporary features in the district’s authoritative data.
Each variable affecting scoring is stored with the asset list so that users can see precisely which factors are influencing the score. This ensures transparency in the scoring process. The application allows users to tweak inputs and evaluate different sets of criteria and the effect on their budget and PLA.
A final list of assets is available for download as a Microsoft Excel spreadsheet for fine-tuning, sharing with a wider audience, or comparing different deployment patterns. In this way the tool provides stakeholders a window on the current state of all the district’s assets as well as a way of evaluating the effectiveness of a variety of response scenarios. This means the tool is delivering a meaningful and justified place from which to start a discussion on expenditures.
This application provides a list of assets ripe for repair or replacement, but it does more as well. It simultaneously provides justification for the consideration of these assets as a capital expense. This allows users to tailor their approach as their unique circumstances dictate. As this solution exists entirely in ArcGIS Online, it integrates directly with all other platform components such as the ArcGIS Field Maps solutions the district already uses, expanding the ROI of the GIS investment.

This project was completed in just under seven months over the spring and summer of 2022. Weston & Sampson is working with the district on full implementation and user training, ensuring that contributing components of the application are ingested as they become available, such as the identification of the paving schedules which are a primary driver for expense.
Savings will be most evident when creating a new CIP and the PLA is already established. This solution attempts to do all the front-end work up to and including the cost definitions on a rolling basis according to an existing, vetted approach, so users can get right to the work of defining projects, saving time and money.
The district is already seeing benefits. It has greater visibility into the spatial distribution of variables impacting its planned budgets. The solution will allow the district to take advantage of the existing static CIP while allowing it to remain purposefully flexible and responsive to developing needs. The next steps for this project will be further integration with the asset management software to include assessment of fire flow readings at hydrants during flushing events. As one of the critical variables impacting assessment, this is a perfect step toward better development of the PLA.
The flexibility of the ArcGIS system means that those inputs can be used directly by the script. The district may elect to expand the solution to manage other assets such as wells, tanks, and booster pump stations. Because these are all inventoried in the district’s ArcGIS Online organization, facilitating the integration of those assets is relatively easy.
The Dedham-Westwood Water District is committed to providing its customers with the best service and best water possible. The CIP Viewer and PLA generator is a unique and innovative step toward assembling some of the most influential factors for managing the assets that help deliver on that commitment. Its flexible and convenient architecture opens opportunities to bolt on additional inputs and expand its scope while refining its recommendations. It is a tool that provides managers insight not only into the condition of their assets but also their organization’s means to effectively minister to those assets. And because it does this actively, it is never out-of-date with current assessments, giving managers and stakeholders a window on their plan as it evolves.


