A network of research partners is using GIS to more effectively site tracking stations that gather data on migratory birds to help reverse decreases in their numbers.
According to “Decline of the North American avifauna,” an article published in the September 19, 2019, issue of Science magazine, there has been a net loss of nearly 3 billion birds since 1970, which is a 29 percent reduction in total bird abundance, and more than 83 percent of those birds are migratory species.
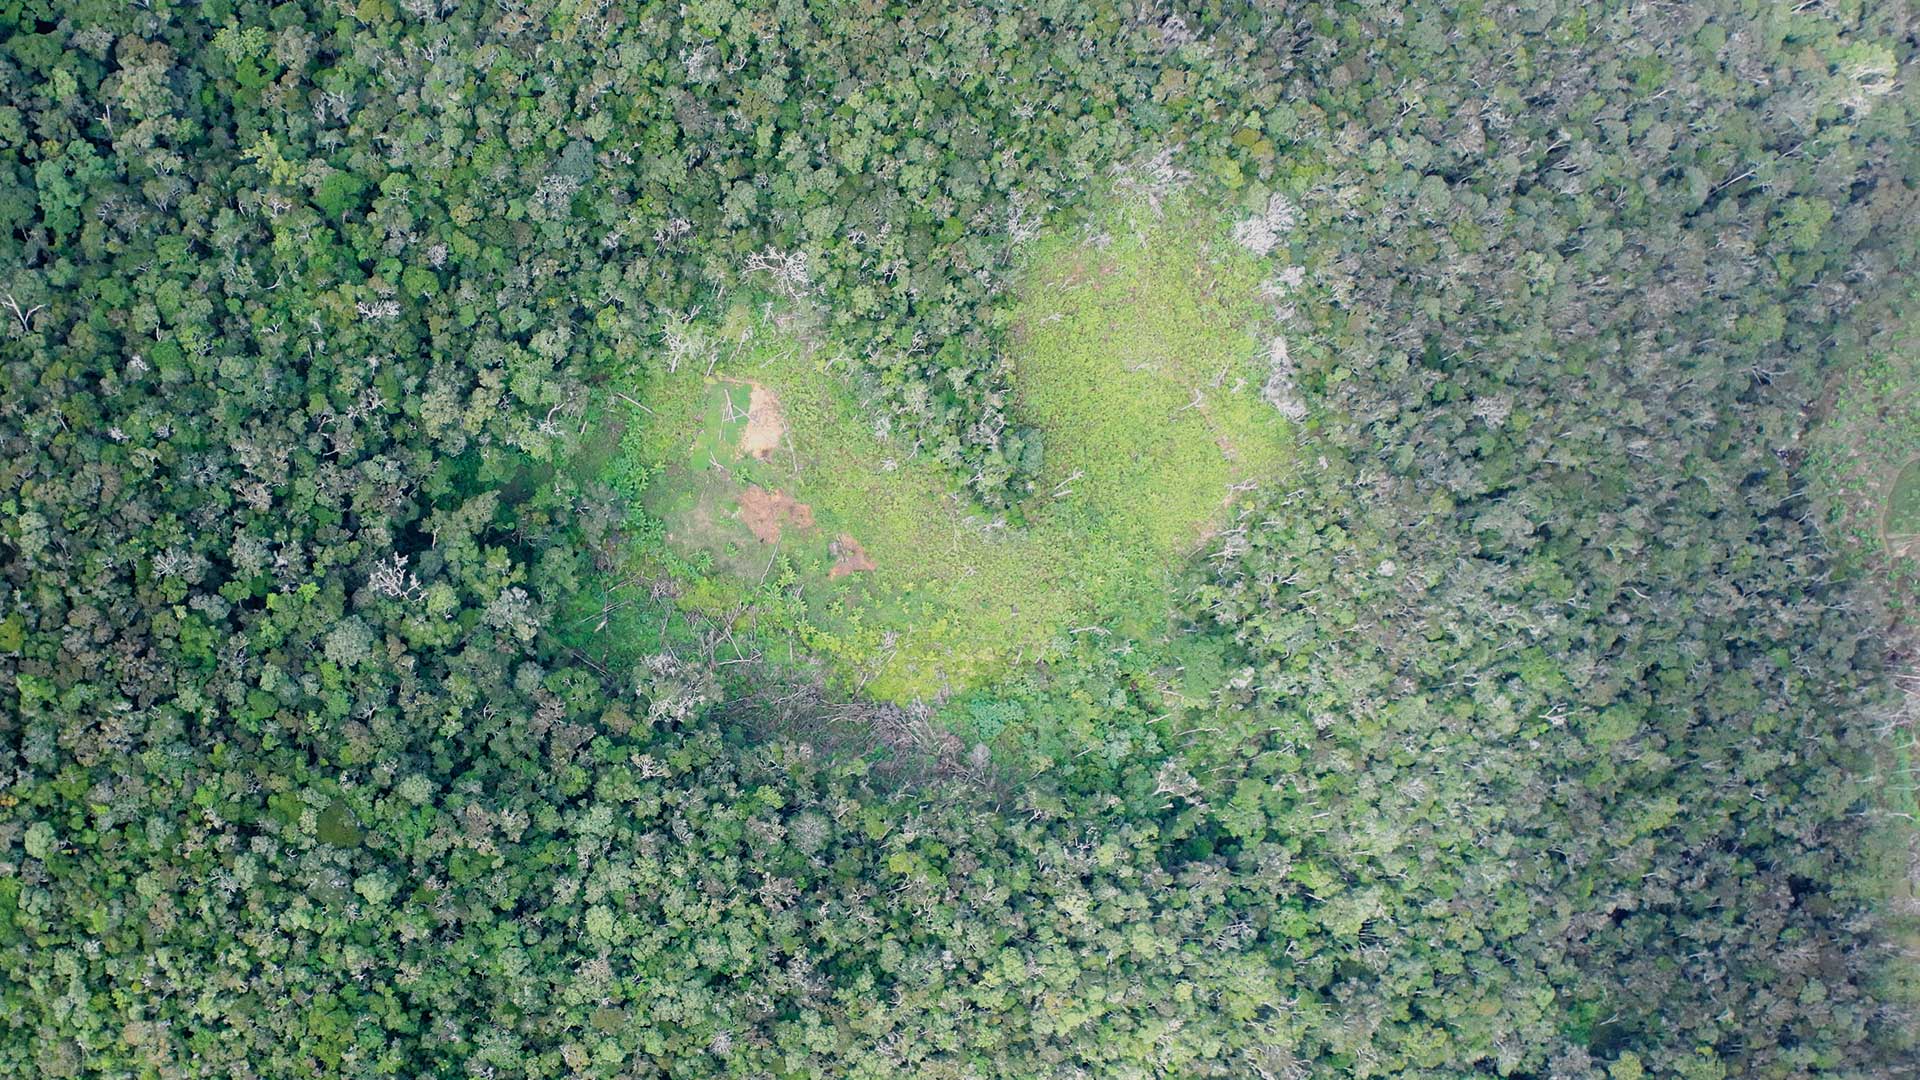
Migratory animals perform some of the most astounding journeys on the planet. These extraordinary animals travel hundreds—if not thousands—of miles every year. Migratory birds, some weighing as little as a AAA battery, can perform nonstop flights of 2,500 kilometers over open ocean. Their ability to make such incredible journeys depends on many factors, especially the location of suitable stopover sites and destinations.
Most migratory bird research has focused on European and North American breeding grounds, with less emphasis on migratory routes, stopover sites, and non-breeding grounds, which are most often located closer to the equator.
What factors are contributing to the steep decline, general ecology, and complex life histories of migratory bird species? While global climate change and habitat loss are certainly factors, understanding key elements of migration, such as changes in migration distance, timing, duration, and persistence of stopover site locations, can help researchers recommend habitat conservation solutions for greater yearly success. Integrating animal tracking technologies with GIS revolutionizes the investigation of climate change and habitat loss impacts on declining migratory bird species.
Tracking Animal Movements
Radio tracking wildlife has been a core technique used for decades. Traditional very high frequency (VHF) radio transmitters are still in use today. However, they require much additional work by researchers ,who must pinpoint a species location with a mobile VHF receiver. Recently, satellite-based technology has increased the spatial precision of tracking animal movements. However, satellite tags can cost up to 10 times more than radio tags. In addition, most radio tags are suitable for larger birds that can handle the additional weight, such as raptors and large waterfowl. Although there are satellite tags designed for smaller birds, they require recapturing the birds to extract and access the data.
A new radio tracking approach that uses nanotags weighing a fraction of a gram allow tracking animals as small as individual insects. Nanotags transmit radio signals on the same frequency but with a unique, digitally coded micropulse that individualizes each tag. These pulses can be detected by automated receiving stations. These stations are elevated structures with multiple antennae that are oriented in different directions and listen at a set frequency.

Motus Wildlife Tracking System
In 2008, Bird Studies Canada began the Motus Wildlife Tracking Network (Motus). [Bird Studies Canada, a nonprofit, is Canada’s national bird conservation organization.] Motus now includes more than 1,200 research partners deploying automated receiving stations (Motus stations) in 31 countries.
Motus station antennae are oriented in specific directions. Depending on visibility, they can detect nanotags up to 15 kilo-
meters (km) away. By strategically installing Motus stations, researchers can create a fence line or grid that tracks nanotagged animals over time. When a Motus station detects a nanotag, it records a time stamp, the radio signal strength, and which antenna detected the signal. When combined with geographic location and antenna orientation, researchers can determine approximate migratory paths and movements.
For five years, the Northeast Motus Collaboration (NEMC) has worked to create an interior network of more than 100 Motus stations in the mid-Atlantic and New England states of the US. Before installing a Motus station, site analysis is necessary for each potential station location.

Geospatial Problems Solved with Geospatial Tools
Initially, Google Earth and site visits were used to manually analyze each station location. However, a more analytical and informative tool was necessary to maximize nanotag detection by ensuring optimal Motus station coverage across the landscape. ArcGIS was adopted so that researchers could share Motus station data, site analysis results, and resources with collaborators.
As the NEMC network continued to grow throughout the northeast US, researchers at Powdermill Nature Reserve, the environmental research center of the Carnegie Museum of Natural History, saw a need to centralize data collected by NEMC and other Motus station locations into a single dataset. Powdermill staff started by creating a feature service and web mapping application in ArcGIS Online that was shared with Willistown Conservation Trust and other collaborators.
This enabled edits to existing and potential Motus station sites. In addition, Powdermill staff created a publicly shared feature layer view and web map without editing capabilities. While this allowed greater control over Motus station data by each organization, existing data could still be shared with outside stakeholders and potential partners who might not have access to ArcGIS Online.
Centralizing Motus data in a shared feature service simplified geospatial analysis for regional planning, so Motus stations could be deployed strategically and efficiently. Since Motus station antennae require good line of sight to the horizon with minimal obstruction, viewshed tools in ArcGIS Pro help optimize antenna coverage to maximize the probability of nanotag detection.
ArcGIS provides several tools for analyzing viewsheds. The Geodesic Viewshed tool (formerly called Viewshed 2) in ArcGIS Pro was chosen for two reasons: its ability to input a vertical observer offset value to account for antenna height and the option to create an aboveground level raster to account for local topography and avian flyways.
To enhance the geospatial analysis planning workflow, Powdermill opted to use Python scripting and ArcPy to generate a custom script tool in ArcGIS Pro. The custom script tool digests new Motus data from the hosted feature service, performs several data management tasks, and outputs viewsheds classified by the required aboveground height for each new Motus feature in a 15 km radius.
With Python as the workflow’s core, Powdermill could extend the customization and functionality of the script tool with other Python modules. For example, the Requests Python package automates the download of additional digital elevation models (DEMs) from US Geological Survey or Natural Resource Canada (NRCan), if they are needed by a new Motus station. Powdermill developed a robust geospatial tool that can be shared with other Motus researchers via an ArcGIS Pro project package.

A Keystone for Motus Research
Since implementation of the script tool, evaluation of potential station locations has resulted in more than 100 Motus station installations. The ArcGIS Online feature service web mapping application is used in semiweekly regional planning meetings for ongoing grants funding Motus work.
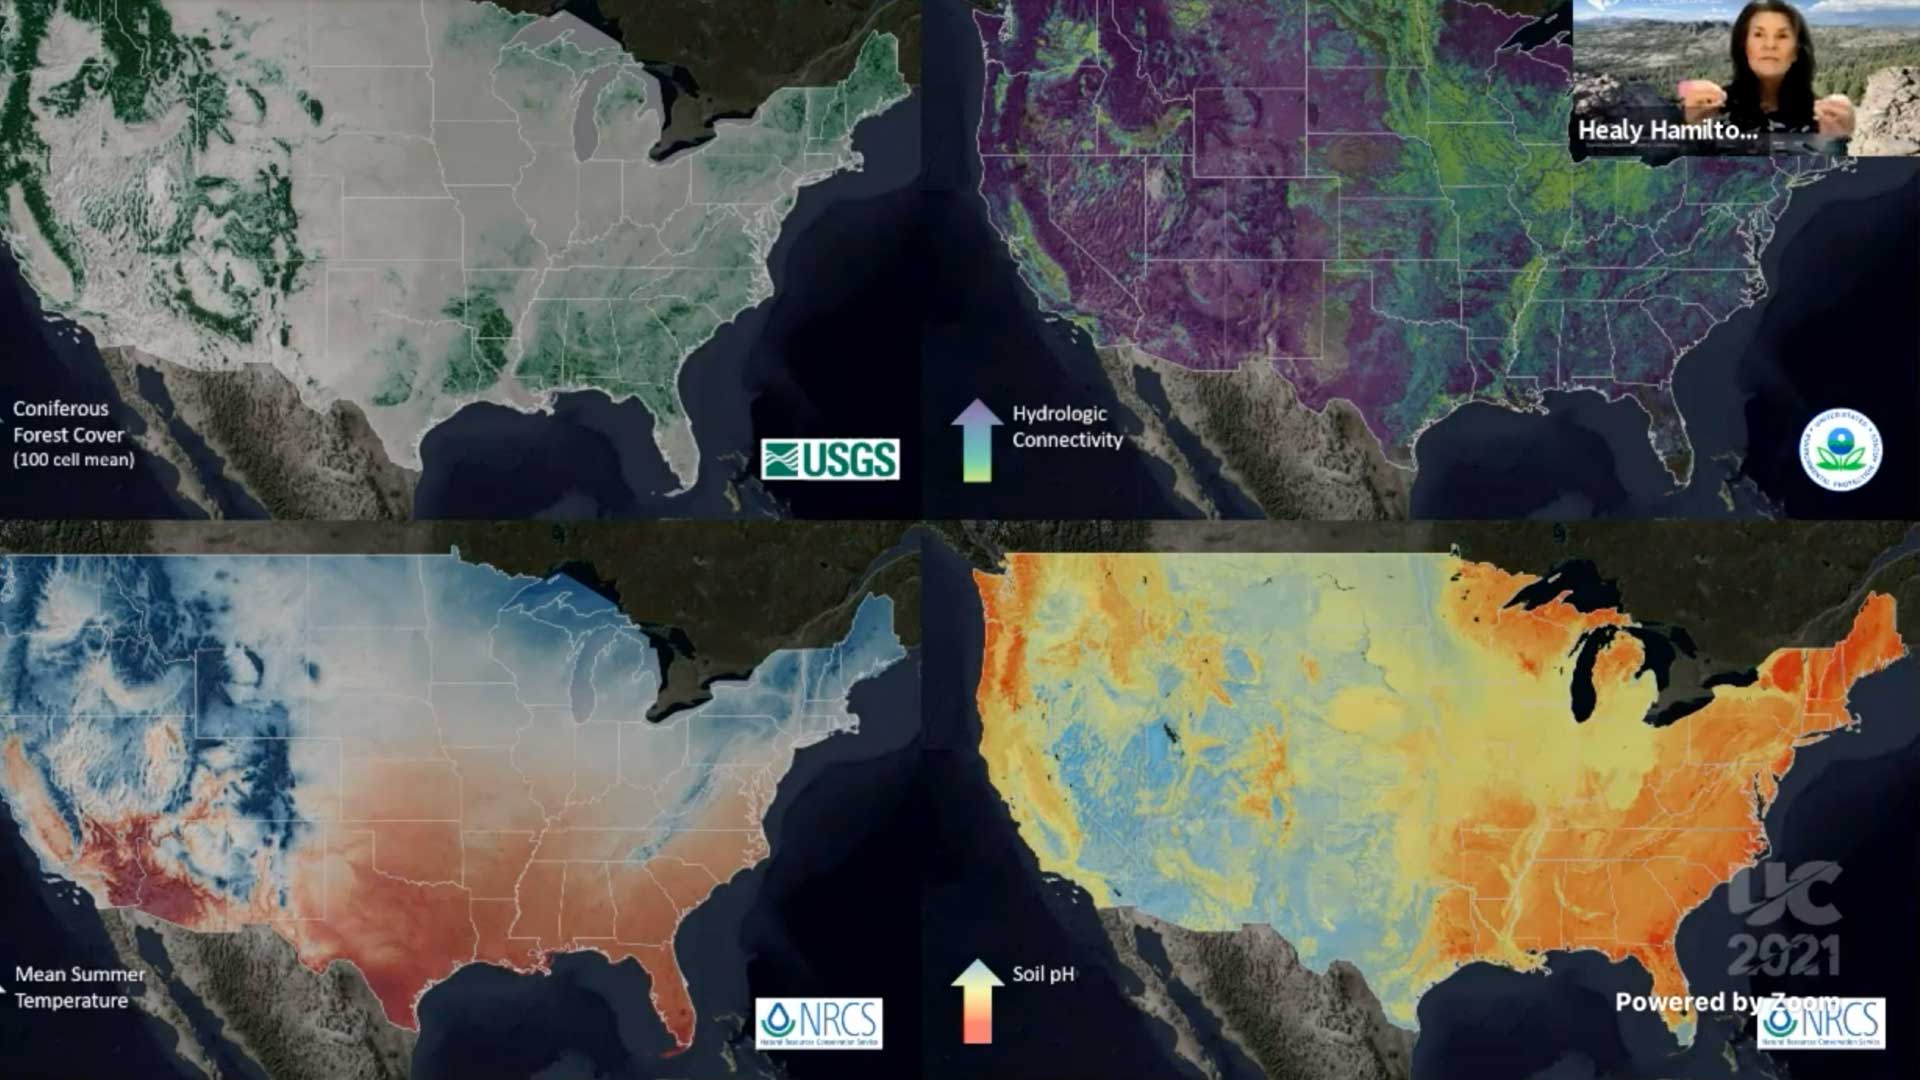
Using ArcGIS for data sharing and analysis has become mission critical for building the Motus network in the northeast US. Managing and sharing data on ArcGIS Online ensures simple and high-quality data collection. By analyzing Motus data in conjunction with other environmental and climatic variables, scientists can better understand why migratory birds are declining. This will improve habitat conservation and restoration efforts along migratory paths, and geospatial tools will continue to play a significant role in future research with Motus data.
For more information, contact Bryce Stouffer at stoufferb@carnegiemnh.org.
Bryce Stouffer is the GIS research scientist at Carnegie Museum of Natural History.

About the authors

Jon Rice

James Whitacre