This is the third tutorial in a series by Esri cartographer Heather Smith on taking your mapmaking skills to the next level by improving how you use text elements in your maps. The previous tutorials, “Improve Your Labeling Skills in ArcGIS Pro” and “Place Text Exactly Where You Want with Annotation in ArcGIS Pro,” appeared in the Winter 2020 issue of ArcUser magazine. All three tutorials use the same ArcGIS Pro project, which can be downloaded in the Darwin.ppkx project package. Although the skills and information in these tutorials build successively, each tutorial can be worked independently using this project. You can start with this tutorial or refer to the previous tutorials and work on any or all of them in any order.
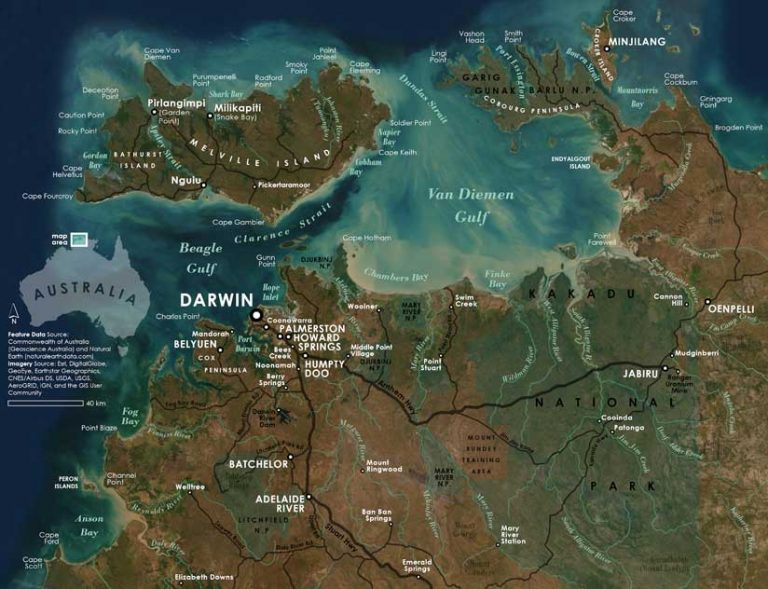
This tutorial finishes the map with layout text. This is the easiest part. It’s the graphic text on your final map that isn’t associated with data layers, such as the title, credits, legends, scale bar, and descriptive paragraphs.
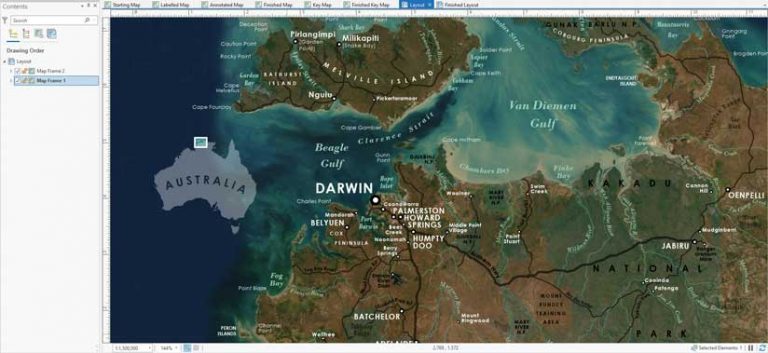
In the Darwin project, click the Layout tab. This layout has two maps. Map Frame 1 is the main map of the Darwin region. Map Frame 2 is the key map of Australia that floats transparently on the upper left side of the main map.
Normally, the first thing I’d do is add is a title, but I think that this map is self-explanatory. The title would just say Darwin, Australia, which is already displayed prominently via labels. The first rule of map layouts is to not add anything that isn’t necessary.
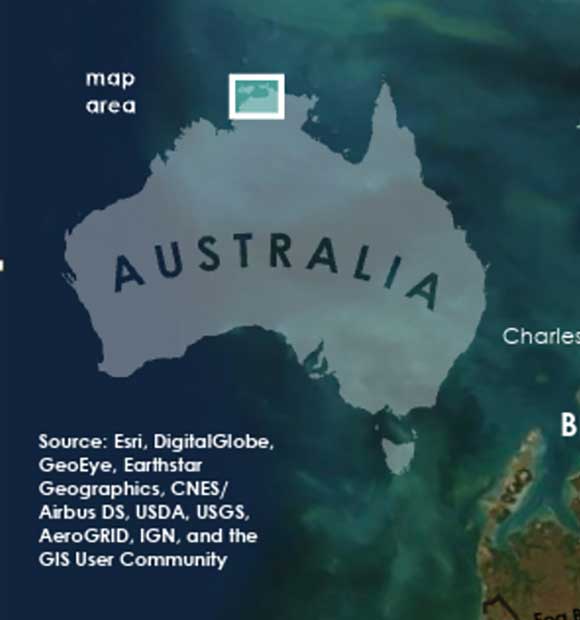
I do want to add some text to the key map. I’m worried that it’s not clear that the little box sitting on top of Australia represents the area of the main map. On the ribbon, click the Insert tab, which contains anything that you want to add to a layout, from photos to graticules.
In the Text section, click the New Rectangle Paragraph button. Drag a rectangle on the layout near the keymap locator box and type the text “map area”. If necessary, double-click the Text element in the Contents pane to open the Format Text pane so you can adjust the Text Symbol properties to match the rest of the map. Click Text Symbol > Properties, and under Appearance, choose Century Gothic, Bold, and 7 pt. Choose white for the text fill symbol and color and no color for Outline color. Click Apply.
If you drag either of the maps around, you’ll find that the map area text stays in place on the page, while all the other text moves with the map. That’s what makes layout text different from labels and annotation. It belongs to the layout, not the map.
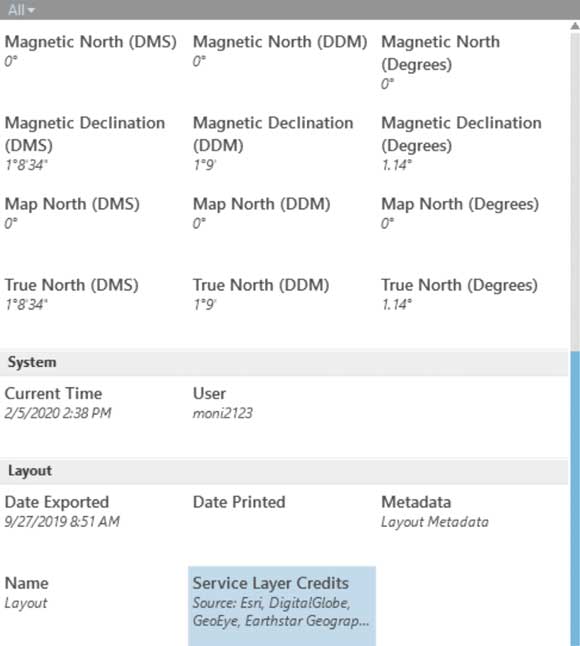
There is some other text on the layout already. It’s the credits for the imagery basemap. And wow, is it hard to read. But don’t worry, you can change this text into something that matches the formatting of the rest of the map.
On the ribbon, click the Insert tab and click Dynamic Text. Scroll down in the menu and choose Service Layer Credits. Draw a rectangle on the map where you’d like the credits to go. The text disappears from the bottom of your map and reappears in your chosen spot. Although you can’t change how the text reads, you can change how it appears.
Double-click Text1 in the Contents pane to open the Format Text pane. Click Text Symbol > Properties > and Appearance to update font properties to match the text for the key map you just placed with the size set to 6 pt.
But you need to cite data sources in addition to those for the basemap. In the Format Text pane, choose Text > Options. Inside the text editing box, there is a tag for the existing dynamic text (serviceLayerCredits). Place your cursor in front of the dynamic text and paste the following text:
Feature Data Source: Commonwealth of Australia (Geoscience Australia) and Natural Earth (naturalearthdata.com) Imagery
If you like, you can also add
Cartography: <Your Name>, <Date>
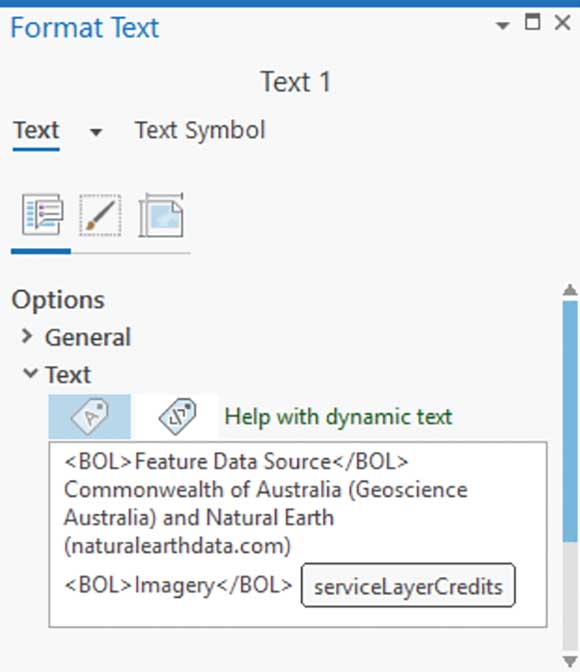
You can also add text formatting tags to make this block of text easier to read. I used <BOL></BOL> to bold some words.
Next, you can add a scale bar. On the Insert tab of the ribbon, click the bottom part of the Scale Bar button. Choose Single Division Scale Bar from the Metric list. Drag a rectangle on the layout to add your new scale bar.
Tip: If your scale bar says something like 2,000 kilometers, it’s referring to the key map instead of the main map. You can fix this problem in the Format Scale Bar pane by changing the Map frame to Map Frame 1.
On the ribbon, experiment with the options on the Format and Design tabs to customize the scale bar until it looks just the way you like. You can refer to the Finished Layout tab to see the settings I used. You can add a north arrow in the same way.
And there it is—a finished map—with label classes converted into annotation, enhanced with masks, and topped off with a bit of graphic layout text.
If you’ve been intimidated by map text in the past, I hope that you can now move forward with confidence and build some truly beautifully labeled maps! Remember that conventions aren’t rules, compromises will have to be made, and research can be fun.