The GIS team in the Utah office of Colliers International created a map style that more effectively communicates data on housing growth while saving the team map production time.
Colliers International provides expert real estate and investment advice to clients in 63 countries. Since 1998, Colliers Utah has provided investment sales, landlord and tenant representation, property management, and valuation services throughout the state. The Utah office operates in one of the fastest growing states. According to the US Census Bureau, Utah’s population has increased by more than 46 percent in the last 20 years. Specifically, the Wasatch Front in northcentral Utah and St. George in the southwestern region are some of the fastest-growing areas in the US.
Developers in Utah face challenges because of the limited space for new construction. Because of these geographic constraints, gaining insight into when and where the next site development should go is crucial. Developers rely on real estate brokers to quickly provide data that is as accurate as possible to make future purchase decisions.
Support for Decisions
To help clients and brokers stay abreast of construction trends, the GIS team at Colliers Utah provides maps and datasets that have proved critical to the company in winning business over local competitors.
Kate Wright and Ernie Cottle, GIS analysts at Colliers Utah, see future housing projects as key economic indicators for growing commercial real estate markets. With this data, the GIS team provides valuable support to more than 200 commercial real estate brokers involved in marketing and investment decision-making.
The GIS team, managed by Tyler Crocker, wanted to improve map visuals to provide brokers with a product that was less complicated to use and easy for clients to understand. Colliers Utah real estate brokers use map visuals in client pitch meetings and marketing materials. Wright and Cottle saw an opportunity to fine-tune several map solutions to better showcase their GIS toolset to stakeholders.
“We need maps that are informative and present accurate data. But we also need them to be aesthetically pleasing, something that can be inserted into a flyer or incorporated into a pitch presentation and look attractive as a marketing piece,” Wright said. “What has been great about using Esri products is that we can accurately map the data that we’re trying to display and also make it look attractive in an all-in-one dedicated program.”
The Colliers Utah GIS team eventually landed on a simple yet dynamic map style. While the map continues to be tweaked and refined, the complete visual overhaul in its stylization was a significant breakthrough.
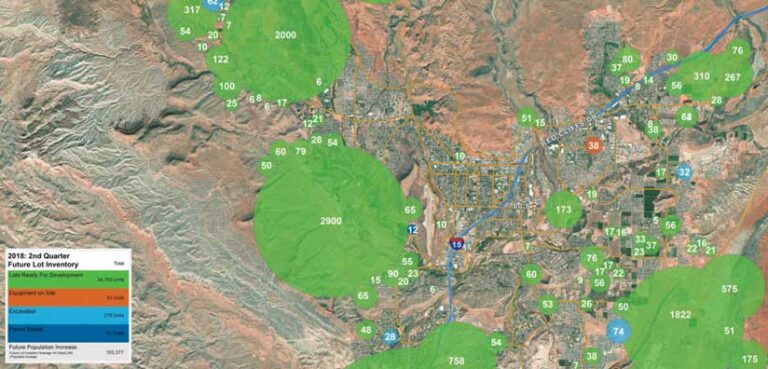
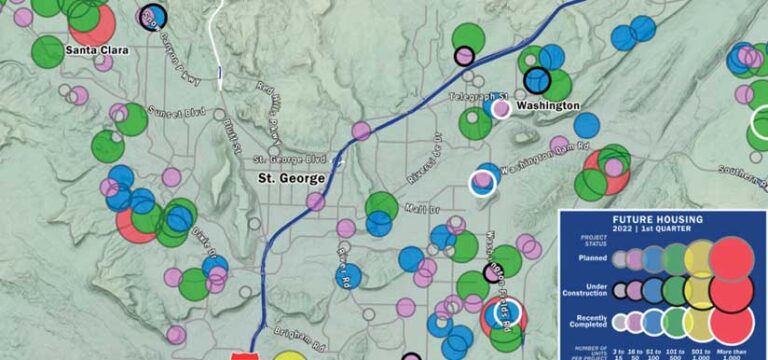
The new map style presents the data in a format that is simple and easy to understand. It combines graduated circles, fills, and strokes to identify housing projects by their size and status. Now brokers, their teams, and clients can easily see where housing developments will be built in an area. Maps can be viewed online or downloaded as static images when needed.
This represents a substantial improvement over previous versions of the map, which required a complex legend and a full-page reference sheet to explain symbols and other map elements to help figure out what was being presented on the map.
Using Esri products and third-party data for local real estate and housing information, the team has furnished insight into the market that brokers value. ArcGIS Experience Builder lets the team transform data into web apps without writing code. With Experience Builder, the site gives users better ways to interact with data than would be possible using a report or static map image.
Greater Adoption and Impact
With the new map style, brokers can help clients make more informed investment decisions in the high-growth market. Since the Colliers Utah GIS team rolled out new maps, team members have noticed positive impacts because of their work.
“When we implemented our new map style, we saw our time generating new maps drop by nearly 75 percent,” said Cottle. This allows the team members to focus on collaborative efforts in map design and marketing.
They have seen greater adoption of the tools among real estate brokers. For example, brokers who at one time were hesitant to use these tools are now incorporating their maps in their marketing and presentations. Having these reports in a presentation provides a competitive advantage over other brokers. The GIS team at Colliers Utah attributes this to the much easier visualizations.
Preloading their data into web apps in Experience Builder has empowered real estate brokers to view and obtain the data they need on their own. This has allowed the team to spend more time building new GIS tools.
Interest in the new maps is growing outside the organization. A few national fast-food chain restaurants and retailers in the local Utah market have used future housing data to help decide on potential store locations. Executives and planners were able to use this data to see more potential store locations in rural areas of Utah that are projected to develop rapidly, according to planned housing data. The data points to significant housing increases in the coming years and opportunities for new store locations.
Other retailers have layered the future housing data from the Colliers Utah GIS team on top of maps that show high-traffic street corners. Predicting where housing is going to be built, along with traffic data, has allowed businesses to be a step ahead in selecting future store sites.
Continued Improvement
The Colliers Utah GIS team has set a goal of improving the map and supplying additional relevant housing information. For example, the team has responded to requests for data on multifamily housing projects and rental units. These new datasets are expected to provide a more complete picture of the future of housing in the area. With the ability to refine this new map with new data and analysis, the GIS team can make its tool a go-to source for relevant data about the future of local housing markets and help Collier stay ahead of the competition.