When earthquakes occur, we often focus on the “big one,” but it is interesting to explore other nearby earthquakes to gain a broader perspective on spatial and temporal seismic patterns underground. Using the most current earthquake GeoJSON feed from the US Geological Survey (USGS), this app visualizes the largest earthquake that occurred anywhere in the world within the last week along with all smaller earthquakes from the same area and time period.
A variety of capabilities in the ArcGIS API for JavaScript are employed to provide this rich user experience. The GeoJSON layer is used to load and parse the USGS earthquake GeoJSON data. Using client-side queries and statistical calculations, the app finds the strongest earthquake in the last week and identifies the other earthquakes that occurred during that week. The magnitude of each earthquake drives the size and color used to display each feature. The larger and redder the symbol, the greater the magnitude.
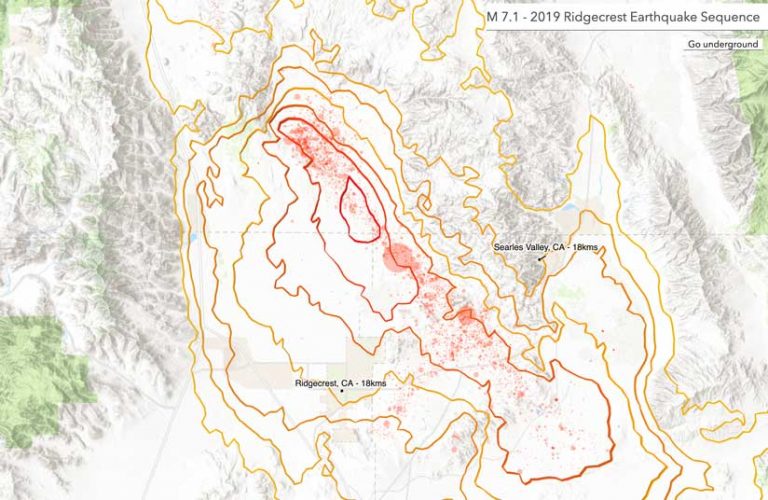
In addition to earthquake locations, the USGS feed contains links to multiple supporting GeoJSON datasets, which are dynamically loaded by the API. One of these datasets, a shake map, indicates the intensity of ground shaking surrounding an earthquake. The shake map is thematically drawn using a 3D path symbol with a continuous color ramp that indicates the intensity of each band.
To let users explore above and below ground, earthquakes are visualized in a 3D scene that includes a clipped area of imagery for the land above the earthquake epicenter. With the app’s time slider, users can progressively display earthquakes that occurred throughout the week. With each adjustment of the time slider, the time extent changes and data is filtered accordingly. Because the time slider works with the data on the client side, map updates happen instantaneously.