It sometimes feels as if there’s little that can bridge our society’s divides—but the married coauthors of a new book from Esri Press—one a Republican, the other a Democrat—are optimistic.
“In city politics, you can battle about a lot of things, or you can figure out how to get food to people who don’t have it. And that shouldn’t be a political fight. That’s just a resource question once it can be visualized,” said Stephen Goldsmith, the former Republican mayor of Indianapolis and deputy mayor of New York City.
He and wife Kate Markin Coleman, a private sector and nonprofit executive who describes herself as a “very liberal Democrat,” explain how one visualization tool in particular—maps—can be used to help solve persistent issues.
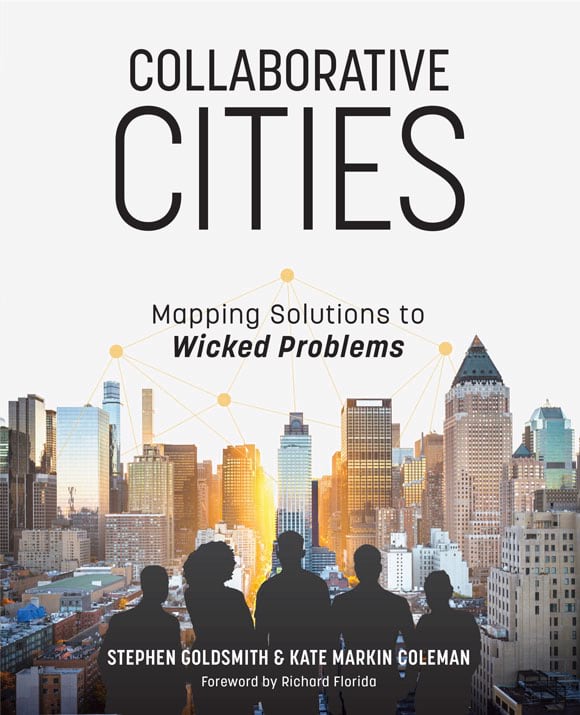
In Collaborative Cities: Mapping Solutions to Wicked Problems, the pair illustrate how a geographic approach can help communities address homelessness, climate change, and childhood poverty, all deemed “wicked” problems because of their complexity.
They’re the type of problems, the authors write, that “demand the kind of creative thinking, democratized engagement, and integrated action that best happens across boundaries when government, nonprofits, businesses, and citizens work in concert.”
Bringing Services to People Where They Live
Goldsmith and Coleman both have had firsthand experience in their careers by using the geographic approach to foster collaboration.
One of Goldsmith’s first goals as mayor of Indianapolis was to improve the quality of life in neglected communities. He went to the lone GIS professional then employed with the city and asked for a map showing the neighborhoods most in need and the assets in those same communities. This led to a $600 million investment in improving seven neighborhoods with the Indianapolis Neighborhood Empowerment Initiative. The effort provided neighborhood and housing services, and programs for beautification, crime watch, and volunteer initiatives.
When Coleman, former executive vice president and chief strategy and advancement officer for the YMCA of the USA, was helping lead the YMCA in Chicago, she also leaned on GIS. Coleman used spatial analysis to better understand the structural barriers that made it difficult for residents to access services despite demographic data showing them to be prime candidates for participation.
In their book, Goldsmith and Coleman point to examples across the US where a possible fix to a problem became evident through geographic awareness and collaboration among interested parties. In all cases, the focus was on the people needing to be served and not the agency providing the service.
In another case, leaders determined the reason residents were missing out on their WIC benefits. [The Special Supplemental Nutrition Program for Women, Infants, and Children (WIC) is a federal program.] A map showed that WIC offices, where individuals could apply for services, were located too far away from the homes of the people the program was meant to serve. Because the federal government entered long-term leases, it meant the offices would have to stay put even if likely clientele no longer lived nearby. A better approach would have been shorter leases nearer to the people needing services. Leaders realized that more attention should be paid to the needs of clients, not the agency.
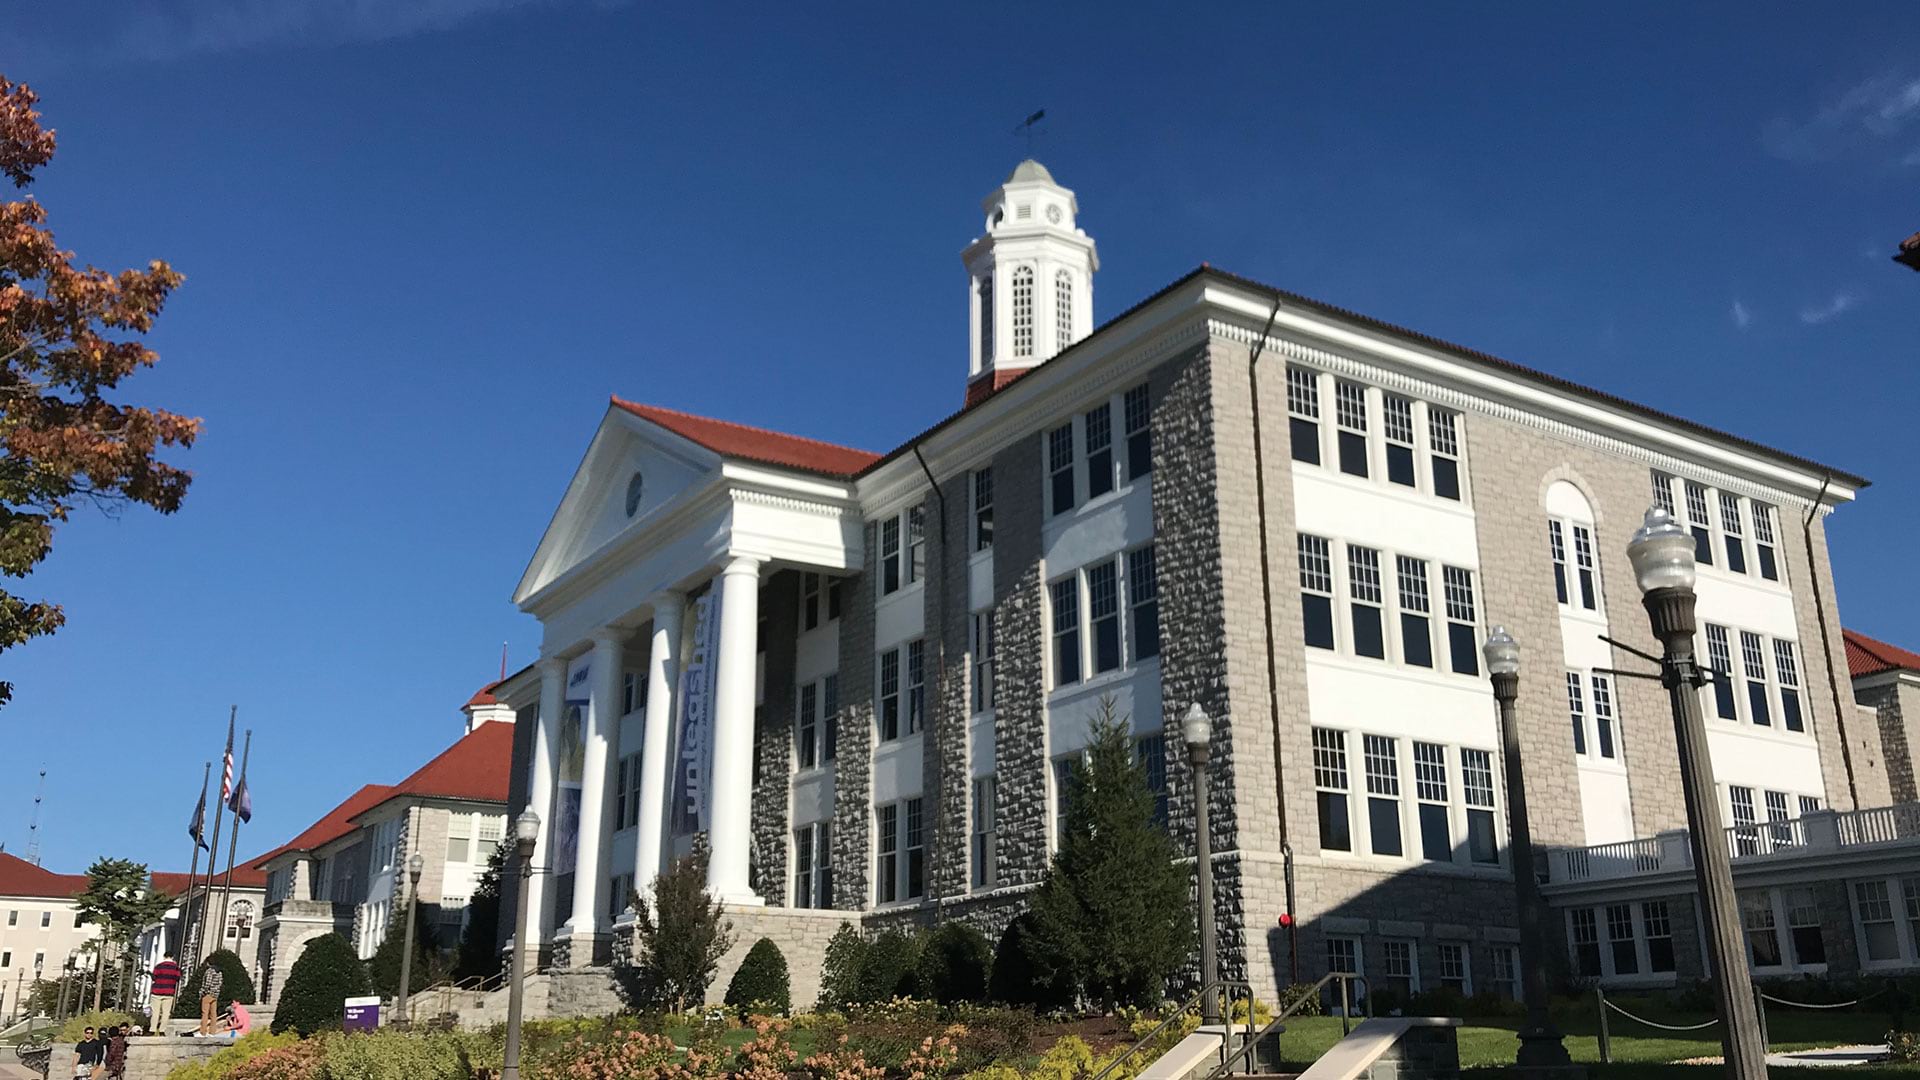
Another example in the book comes from Richmond, Virginia. In 2018, city leaders wanted to turn around abysmally low participation rates in afterschool programs. They convened a group that included Richmond Public School representatives, nonprofits, community members, and after-school program providers. Afterward, Mayor Levar Stoney launched a plan to provide “out-of-school” programs to all the city’s elementary and middle school students. The group had discovered, through mapping, that at least two schools in the city provided no after-school programs at all. One of the group’s members, Kimberly Bridges, told the authors that simply mapping the number of children in after-school programs and slots available by school inspired expansion.
“Just putting the information on paper, having people look at where there were and were not programs, was enough to catalyze really powerful discussion and build relationships in a way that pushed the collaboration forward,” Bridges said.
Making the Time to Rethink Approaches
The book notes other efforts to colocate social services and connect like-minded organizations to team up so there is less overlap in services. Sometimes these ideas, as logical and rewarding as their results may be, have faced implementation challenges.
“When people’s heads are down because they are underresourced, they don’t have the bandwidth to think in bigger pictures. I saw that all the time. We so underfund the infrastructure of social service organizations that people are doing too many things and don’t have the time to step back and rethink processes or approaches,” Coleman said.
That’s why collaboration among groups that cut across various sectors—philanthropy, government, business—can help.
“When you have all of those together, you develop tentacles that are able to reach out into the community and secure the necessary funding and enabling legislation,” she said.
Even if a program doesn’t formally get off the ground, the informal coalescing of different groups and ideas can provide tangible results that are carried forward.
The pair also point out that as well-meaning as government funding can be, it often encourages the kind of silos that make things less efficient for people who need services.
“Money tends to fund the solution of a problem, right? You don’t have enough food; that becomes a food program. You don’t have enough shelter; that’s a shelter program. You don’t have enough safety; one responds with policing. But of course, the proposition in the book and [in] life is that you don’t live in a program. You live in a place and experience a multiplicity of issues. The way government funds programs aggravates the divisions,” Goldsmith said.
Often, the result of geospatial analysis can be a surprise to those who may not have been fully aware of who their community members are and what they need.
“You don’t really appreciate the conditions someone is living in until you can see and understand those conditions, where they’re located, and how different they are from the ones you experience,” Goldsmith said. By connecting with maps to show and describe those conditions, Coleman thinks leaders can build the political capital necessary to intervene in some of our most difficult problems.
The authors noted: “If you live in a world where you never see poverty, homelessness, or starvation, you don’t have an accurate opinion of the challenges faced by other folks.”
Read Collaborative Cities: Mapping Solutions to Wicked Problems from Esri Press.