Editor’s note: The author developed a suitability model that allows users to determine suitable anchorage locations for National Oceanic and Atmospheric Administration (NOAA) Global Navigation Satellite System (GNSS) tide buoys located in the US Exclusive Economic Zone (EEZ).
Identifying the anchorage of NOAA GNSS tide buoys is an important component that supports one of NOAA’s primary missions: charting depths for safe and efficient navigation via its nautical chart suite. Deploying GNSS tide buoys to update vertical datums is the principle reason that this anchorage suitability model is important. [According to NOAA, “A geodetic datum is an abstract coordinate system with a reference surface (such as sea level) that serves to provide known locations to begin surveys and create maps. Horizontal datums measure positions (latitude and longitude) on the surface of the earth, while vertical datums are used to measure land elevations and water depths.”]
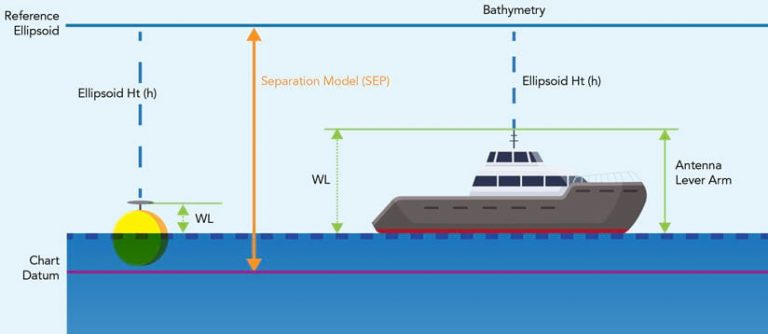
GNSS tide buoys allow NOAA to collect ellipsoid heights and water level data, evaluate the measurements, and empirically determine the vertical difference between the ellipsoid and tidal datums. [A tidal datum is a standard elevation defined by a certain phase of the tide.] Equipped with accurate information derived from tide buoys, NOAA hydrographers and cartographers can properly chart soundings (or depths), which use vertical transformations between the ellipsoid and tidal datum to convert in situ sonar depth data to the appropriate tidal datum such as Mean Lower Low Water (MLLW), which is the tidal datum used for the majority of US nautical charts. [MLLW is the average of the lower low water height of each tidal day observed over the National Tidal Datum Epoch (NTDE). NTDE is a 19-year period established by the National Ocean Service for collecting observations on water levels and calculating tidal datum values.]
As the quantity and density of measurements increases, vertical transformation models, also known as separation (SEP) models, increase in accuracy. Therefore, more buoys are needed to acquire more accurate data.
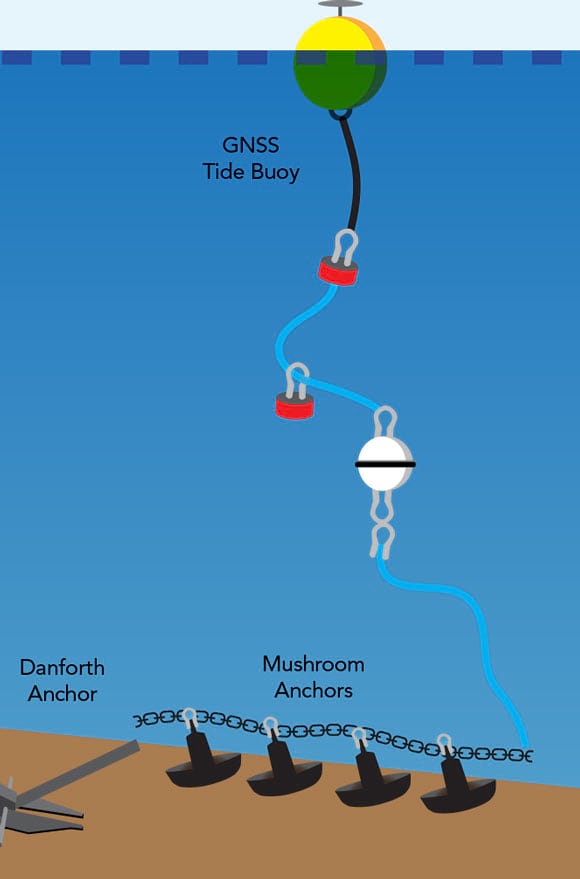
After extensive testing and validation of the anchorage suitability model, the use of GNSS tide buoys will be expanded to support NOAA field operations. This will require predetermining suitable locations to anchor the buoys. Buoys must maintain position for long durations under defined environmental conditions. It is equally critical that suitable anchorage locations for the buoys are established throughout the entirety of waters within the US EEZ. This is the area where the US government assumes jurisdiction over the exploration and exploitation of resources 200 nautical miles offshore from the nearest shoreline maritime boundary point.
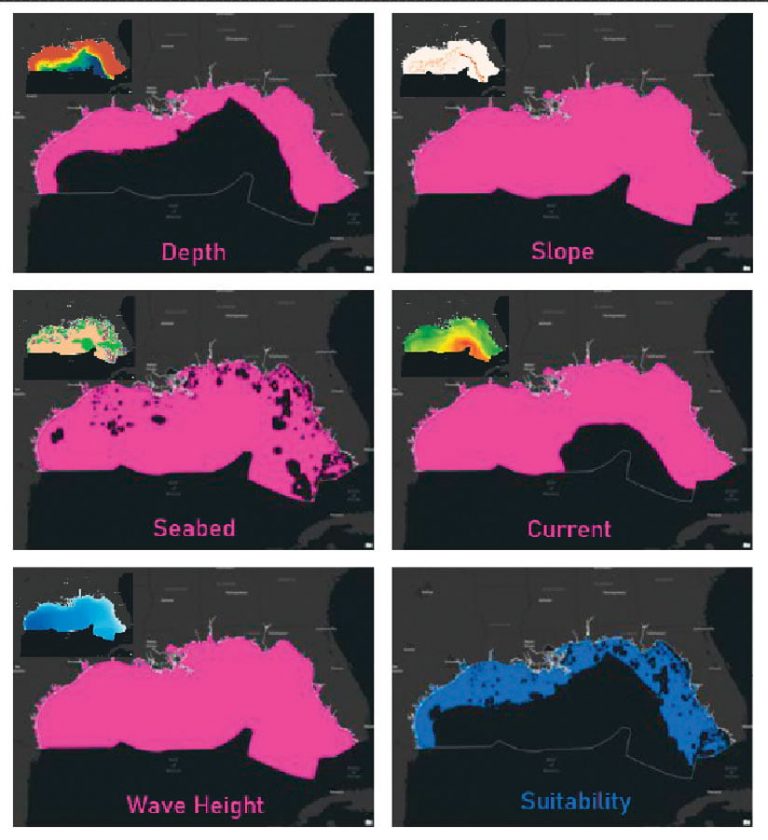
The main objective of this project is to allow users to determine suitable anchorage locations for NOAA GNSS tide buoys in the US EEZ based on depth, slope, seabed, current, and wave characteristics using Python scripts that utilize GeoPandas [an add-on for the open-source Pandas library] to manipulate tables and ArcPy, a Python site package, to create custom ArcTools that run suitability analysis and geoprocessing. The following steps were taken to facilitate the determination and evaluation of suitable anchorage locations for NOAA GNSS buoys:
- Develop a manual suitability model to determine appropriate anchorage locations.
- Implement the suitability model using ArcPy and GeoPandas Python scripts to create custom toolboxes for parameter, conditional, and suitability raster creation.
- Run suitability models for Alaska, conterminous United States (CONUS) East/Gulf/West, Hawaii, and Puerto Rico EEZs.
- Evaluate the impact of each characteristic on the suitability model using sensitivity analysis.
ArcGIS Pro was used to develop, implement, and run the suitability model. GeoPandas Python scripts were used to modify tables and prepare raw data for the ArcPy Python scripts that created the custom tools. With these custom tools, rapid and standard workflows were developed.
In the rapid workflow, the user creates a raster for each parameter from raw data, then creates a suitability raster from the parameter raster using the raster calculator that runs inside the tool. The user creates only parameter and suitability rasters.
In the standard workflow, the user creates a raster for each parameter from raw data, then creates a conditional raster from a parameter raster, then creates a suitability raster from the conditional raster. The user can create visual aids for each parameter, condition, and suitability.
A sensitivity analysis tool was also developed using ArcPy. It creates a text file for 16 suitability model tests. A baseline uses parameters for the conditional value of each characteristic in the documented workflow. Three tests for each characteristic use different values for those parameters. The text file is imported into Microsoft Excel and used to create graphs for analysis. The final suitability pixel count for each model is graphed relative to the user-defined parameter values. This process is repeated for all suitability parameters for a given EEZ. Each is analyzed, and the sensitivity of each is ranked. Final sensitivity analysis showed that depth and wave height have the largest impact on suitability in all EEZs except CONUS East, where seabed is the most significant characteristic followed by depth and wave height.
In total, there are nine tools: four parameter tools, two condition tools, two suitability tools, and one sensitivity analysis tool. ArcPy scripts for customized tools further allowed the user to define the resolution and projection of outputs, raster mask feature classes, required inputs, and output names and directories.
The tools can be easily manipulated to include additional publicly available data, such as Automatic Identification System (AIS) or Dangers to Navigation data, or use alternative sources of seabed data or data in other formats. The custom tools also foster repeatability but still provide agility. By using compartmentalized modules, one can rerun parts of a process instead of one long process or tool that burdens the user with far too many inputs if variables change or an error is made. The tools provide ease of use and improved workflow efficiency via user-friendly interfaces for a task that is time-consuming and needs to be performed for more than one area.
Although the project focuses on locating NOAA GNSS tide buoys, the model can be used for any floating platform, such as another buoy type or a ship. It could also be used for a fixed platform, such as an offshore wind farm. By modifying its scope, the application could be used to build other tools for studies based on the model’s adaptability, modularization, and workflow.
NOAA hydrographic surveys require planning but can require quick changes in location or platform, depending on budget and survey requirements. Simple changes in location can result in complicated, on-the-fly modifications that cost time and money. Automated, binary suitability analysis allows for simple solutions to what could become complicated, time-consuming tasks. The suitability analysis is a cost-efficient, easily deployable solution that helps NOAA scientists quickly decide where to anchor GNSS tide buoys in conjunction with hydrographic surveys for nautical chart updates.
For more information, contact John Doroba.
About the author